
Hello, all. My name is Jeongil Kang, and I'm a technical writer at LINE. How are you all doing? I can't help but ask about your well-being first amid the ongoing COVID-19 pandemic. COVID-19 has brought a lot of changes to our lifestyles. Among those changes, one of the more noticeable ones was that most conferences have shifted to being held online. While I was there in person to attend Write the Docs Prague back in 2018, it went online in 2020 so I had to participate remotely. In this post, I'd like to introduce one of the sessions from Write the Docs Portland 2020 online.
Before directly jumping in to the main story, why don't you think back to your own experiences with software architecture diagrams. You probably would agree that software architecture diagrams are an easier and quicker way to understand the big picture of software architecture as opposed to plain text. That's why we often rely on software architecture diagrams when we collaborate with colleagues or have a meeting with partners. On the other hand, if you're not comfortable with drawing software architecture diagrams, it would take a lot of time and effort to accomplish the same goal. You might not know which tool to choose or where to start. Even after you find a tool and start working on it, you would stop and seek advice if you're on the right track.
I'm going to share Avi Flax's Set your data free with model-based architecture diagramming in this blog post because I think his session can help us make the most out of software architecture diagrams.
This is what I'd like to explain in this post:
- Data/text based software architecture diagramming
- Experiences with software architecture diagramming
- The C4 model
- Text-based C4 model diagramming tool, C4-PlantUML
- Wrap-up
Data/text based software architecture diagramming
Avi, our presenter, has a lot of experience in writing docs with internal software architecture. He says the fundamental question about software architecture is:
What systems do we have, and how do they relate to each other?
And, he suggests that this question can be answered through "software architecture diagrams." Then, Avi mentions many would connect software architecture diagrams to a confused mess of lines and boxes, something like this. So, "(only when they are great) they CAN give you the answer."

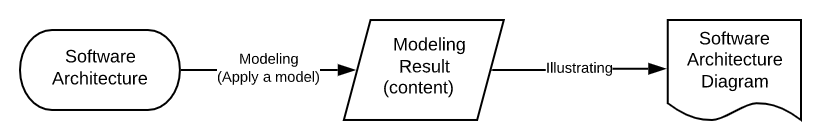
Avi emphasizes that software architecture diagrams are a powerful and effective way to communicate and learn the architecture of a system. Then, he points out modeling and illustrating should not be combined when creating software architecture diagrams. Modeling and illustrating in terms of software architecture diagrams can be defined as follows.
- Modeling
Discovering and confirming what relevant elements exist, why they're relevant, and how they relate (in software architecture based on a specific model) - Illustrating
Devising a visual representation of those elements and relationships (identified through modeling)
Modeling results can be considered as interim content in the process of software architecture diagramming while illustrating is a way to produce the visual presentation of such results with diagrams. The key message of the session was to "apply the separation of content and presentation to software architecture diagrams."
Avi also explains why we should consider the separation of content and presentation.
- Collaboration: Easy to collaborate with others
- Consistency: Keep the information in sync, achieving consistency
- Focus: Create a focus on each topic
- Text: Use a text-oriented version control system (in other words, apply the Docs as Code philosophy)
- Data: Manage and use the software architecture model as data
Then, Avi moves on to how we can do this. Let me explain by adding my experience to Avi's presentation.
Experiences with software architecture diagramming
Maybe not as much as Avi, but I also have a good deal of experience with software architecture diagrams during my career as a technical writer. Documents as a deliverable of software projects vary in type and characteristics, depending on the development process and scope of deployment. Consequently diagrams included in the documents would vary as well. Based on my technical writing experiences, I'll elaborate on documents required during software design stage and after implementation.
Diagrams during software design stage
I'll start with my experience with design documents. Once I had to write software design documents for automotive electronics, which may lead to critical situations in case of a problem. This project carried more weight than others, especially since software design documents were submitted as a basis for product reliability testing. The scope of my work included deliverables during the software design stage such as software requirements specifications (SRS), software architecture documents (SAD) and software design documents (SDD). As I collaborated with software designers and module developers to produce design docs, I also had to create unified modeling language (UML) diagrams from an architectural view1 for respective stakeholders.
As I prepared these documents, I realized diagrams at the design stage are straightforward for writers or readers as architectural views and UML specifications are very clear (Refer to the book called Documenting Software Architecture). However, there was a substantial entry barrier to fully understanding diagrams. In addition, it required a lot of attention and a sophisticated, expensive modeling tool to produce diagrams that delivered high standards and complied with the given rules. Many even prefer drawing diagrams on a whiteboard as shown above because it is simpler and easier.
Diagrams after implementation
Diagrams are also included in developer guides or API reference documents written after software implementation. For conceptual content such as an overview section, diagrams are provided to explain how to use a software or to describe internal components or workflows. Sequence diagrams or activity diagrams are for task type content, requiring user actions, while state transition diagrams are good for reference type content or design guidelines. When writing a guide or API reference document, I sometimes just stack up boxes or drew lines between components to describe software architecture or configurations without a separate set of standards or rules (except for some UML diagrams). This can be simply done with tools like Microsoft PowerPoint, Microsoft Visio, Giffy or Lucidchart without learning complicated expressive specifications such as UML.

The downside of drawing diagrams without objective standards is that you cannot ensure your collaborators or audience will understand those diagrams as intended. In other words, those diagrams were not clearly expressive because modeling and illustrating were not distinctively separated and defined. Even if I maintained consistent rules for diagrams within a specific document, those rules often changed on a different document. It was even more difficult to keep consistency when many writers work together on a large set of documents because everyone applied their own style when drawing diagrams.
Must-haves for software architecture diagramming
My experiences as shared above helped me to understand how to produce software architecture diagrams. I came to conclude that software architecture diagramming must have the following characteristics.
- Keep costs and time low to produce and maintain diagrams
- Apply consistent architectural view and comply with standards for accurate expressions
- Make architectural view or models simple for any software developer to understand and draw
I have been searching for a diagramming method with such characteristics. I was lucky to come across PlantUML when I was collaborating with Jeongun Jeon, a document engineer and technical writer (who also published a blog post, API documentation with comment parsing) back in 2018.
Open source text-based diagramming tool, PlantUML
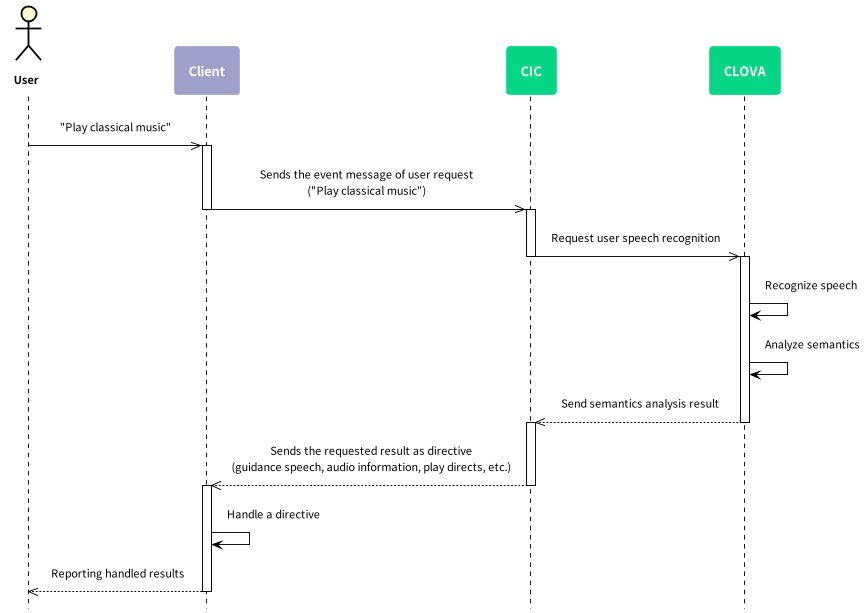
PlantUML is an open source project that allows you to quickly produce diagrams just by using plain text. It can be used to create about 10 different kinds of diagrams including UML diagrams. I was able to use PlantUML to implement the Docs as Code philosophy and I continue to frequently use it during documentation. Below is an example of text-based diagramming.
Example 1 - CLOVA
!include ../../../styles/PlantUML_StyleSheet.puml

actor User as user
participant Client as client #9EA0CA
participant CIC as cic #05D686
participant CLOVA as clova #05D686

user ->> client: "Play classical music"

activate client
  client ->> cic: Sends the event message of user request
("Play classical music")
deactivate client

activate  cic
  cic ->> clova: Request user speech recognition
deactivate cic

activate clova
  clova -> clova: Recognize speech

  clova -> clova: Analyze semantics

  clova -->> cic: Send semantics analysis result
deactivate clova

activate cic
  cic -->> client: Sends the requested result as directive
(guidance speech, audio information, play directs, etc.)
deactivate cic

activate client
  client -> client: Handle a directive
  client -->> user: Reporting handled results
deactivate client
Example 2 - LINE Login

@startuml
/' Formatting '/
title Register new user with access tokens [✅SECURE]
hide footbox
!include ../../plantuml-stylesheet.puml

actor user as "User"
participant app as "Client
(your app)"
participant SDK as "LINE SDK"
participant server as "Your server"
participant LINEp as "LINE Platform"

user -> app : Log in with LINE
activate app
app -> SDK : Log in
activate SDK
app <-- SDK : Success (accessToken)
deactivate SDK
app -> server : accessToken
note right of app
  The client never sends
  user profile information,
  only the accessToken.
end note
activate server
server -> LINEp : [[/en/reference/line-login/#verify-access-token GET /oauth2/v2.1/verify (accessToken)]]
activate LINEp
server <-- LINEp : 200 OK (client_id, expires_in)
deactivate LINEp
server <-- server : Check:
- client_id == LINE Login channel ID?
- expires_in > 0?
note right of server #LightSkyBlue
  ✅ If the accessToken is
  valid, the **server** can
  use this accessToken to
  retrieve the user profile.
end note
server -> LINEp : [[/en/reference/line-login/#get-user-profile GET /v2/profile (accessToken)]]
activate LINEp
server <-- LINEp : 200 OK (User profile)
note right of server #LightSkyBlue
  ✅ The **server** can use this
  user profile information
  because it comes directly
  from the LINE Platform.
end note
deactivate LINEp
server <-- server : Create new user (User profile)
app <-- server: Success
deactivate server
user <-- app : You're logged in!
deactivate app

@enduml
Example 3 - GDC
 |
|
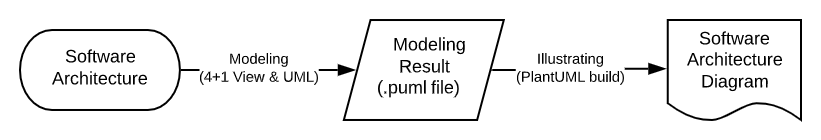
Thanks to PlantUML, I was able to keep consistency in my diagrams and it made the illustrating process much more efficient. In particular, it significantly saved maintenance effort as I could simply update the text without having to draw a new diagram. When you use a CI (continuous integration) tool like Jenkins to automatically build diagrams or load PlantUML data on the web for dynamic rendering, you could update diagrams almost in real time. Once you separate modeling for content and illustrating for presentation, it gives you a lot of benefits. In the same vein, Avi also recommends text or data-based diagramming tools such as PlantUML or Mermaid instead of drawing tools such as Microsoft Visio, Giffy, or Lucidchart.
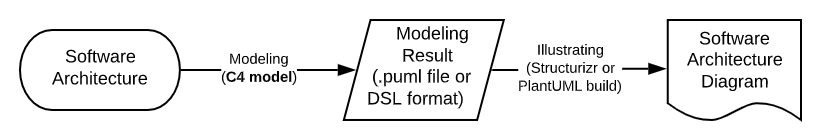
Software architecture diagramming process with PlantUML can be described as follows.
What even PlantUML couldn't deliver
Despite how PlantUML enables us to keep consistency with diagrams and produce diagrams efficiently, there is still something that PlantUML couldn't fulfill. PlantUML is focused more on the illustrating process so I still had to rely on a traditional model for generating interim content. It was still complicated and difficult as I had to use an existing methodology for modeling software architecture and converting them as data. This weakness was against the third characteristic of software architecture diagramming mentioned above. Because of this constraint, I don't use PlantUML for diagrams that describe system architecture or configurations to explain concepts.
I was in search of a tool that makes collaboration on modeling simple and expressive, compared to UML. Avi introduced the C4 model during his session and I found it relatively easy and simple. Avi did not cover the C4 model in detail so I'd like to elaborate on C4 model together with a presentation tool called C4-PlantUML.
The C4 model
What intrigued me the most from Avi's session was the C4 model. The C4 model was built by Simon Brown based on UML and the 4+1 architectural view model. This model breaks down software into smaller units for modeling. In short, it distinguishes the level of a diagram into system context, container, component, and code. The name, C4, represents the number of levels in this model that start with the alphabet C. Similar to the agile methodology, the C4 model is recommended when it requires quick and efficient sharing and constant updates of software architecture during ongoing software development. It is suitable for the static view of software architecture.
The C4 model can be explained as a map. Maps can be drawn with a different scale. By changing scales, for example, you can have a world map with countries and continents or a town map with streets and buildings. Like so, the C4 model differentiates the level of a diagram to depict software architecture. Using the abstraction-first approach, C4 conducts modeling top-down from system context to lower levels. Refer to the following video stream on the C4 model by Simon Brown.
In summary of this video or the C4 model, we need the following abstractions.
- Person
Element presenting users or roles of a software system - Software system
Topmost level in abstractions that represent the value of existing systems or systems under development and the interaction between those systems - Container
Element representing the internals of software systems; usually applications or solutions for data storage. A different concept to containers in Docker. The examples of a container are servers or client applications (for example, web, mobile, or PC), CLI applications, batch processes, databases, blob storage, file systems, or shell scripts. It mainly refers to a software that is independently deployed. - Component
Abstraction element representing the internals of the container of such modules or a set of interfaces that can be grouped as a functional unit. In Java or C# terms, they can be seen as a set of classes implemented for interfaces or packages. They differ from containers as these cannot be deployed independently. - Relations
Representing dependencies or data flow between abstraction elements
Now you can put these abstraction elements to the appropriate level of a diagram. There are no notation rules set in stone for the C4 model. There are still some guidelines for your reference:
- Diagram guideline
- Give a title to the diagram and indicate the level of the diagram (for example, "System context diagram of my software")
- Show a key/legend
- Be wary of using acronyms or initials
- Element notation guideline
- Be explicit about the type for all elements
- Add a short description for all elements
- Include adopted or base technology for containers and components
- Relation notation guideline
- Favor uni-directional lines
- Add a short description for all lines
- Include a technology or protocol used to exchange data between containers
Let's draw a diagram at each level using abstractions based on the respective guidelines. I'll use CLOVA AiCall (link in Korean) as an example. I'll start with a high-level system context diagram to show the target system and its interactions with other systems or users. The diagram should be created for non-engineers to understand the overall concept and relations.
| 1. Create a box for the target system with a brief description |
|---|
 |
| 2. Add a system or user that interacts with the target system and add their description |
 |
| 3. Draw lines with an annotation to show how each element interacts. Say if you're drawing a line from Element A to Element B, you can consider Element A as a subject and Element B as an objective. |
 |
| 4. Being the topmost level of a diagram, system context diagrams should provide a big picture of the overall architecture instead of narrowly focusing on a few elements directly linked to the target system. Don't forget to include a legend. |
 |
Level 2 is a container diagram. Imagine that you're looking into the internal workings of CLOVA AiCall from the system context diagram. First, draw the boundaries of CLOVA AiCall and elements related to CLOVA AiCall from the system context diagram.

Then, list up software elements that can be deployed independently as a container, and then represent the relations between each container and external systems or users. Unlike in the system context diagram, note that it is important to emphasize which technology is used in each element by adding descriptions or when drawing the lines. This diagram is for the high-level design stage and it can be useful for software designers and developers and project manager and members. Below is an example of a container diagram.

Component diagram is a diagram zooming into each container on the container diagram. It is not often used for documents at the early stage of design, developer guides or API references. Component diagrams describe which components or modules that software designers and developers implemented and their roles and relations.
Like so with container diagrams, you should start with the boundaries of the target component and move on to component elements related to the target component as indicated in the container diagram. Now you're ready to draw a component diagram with AiCall interface elements as follows.
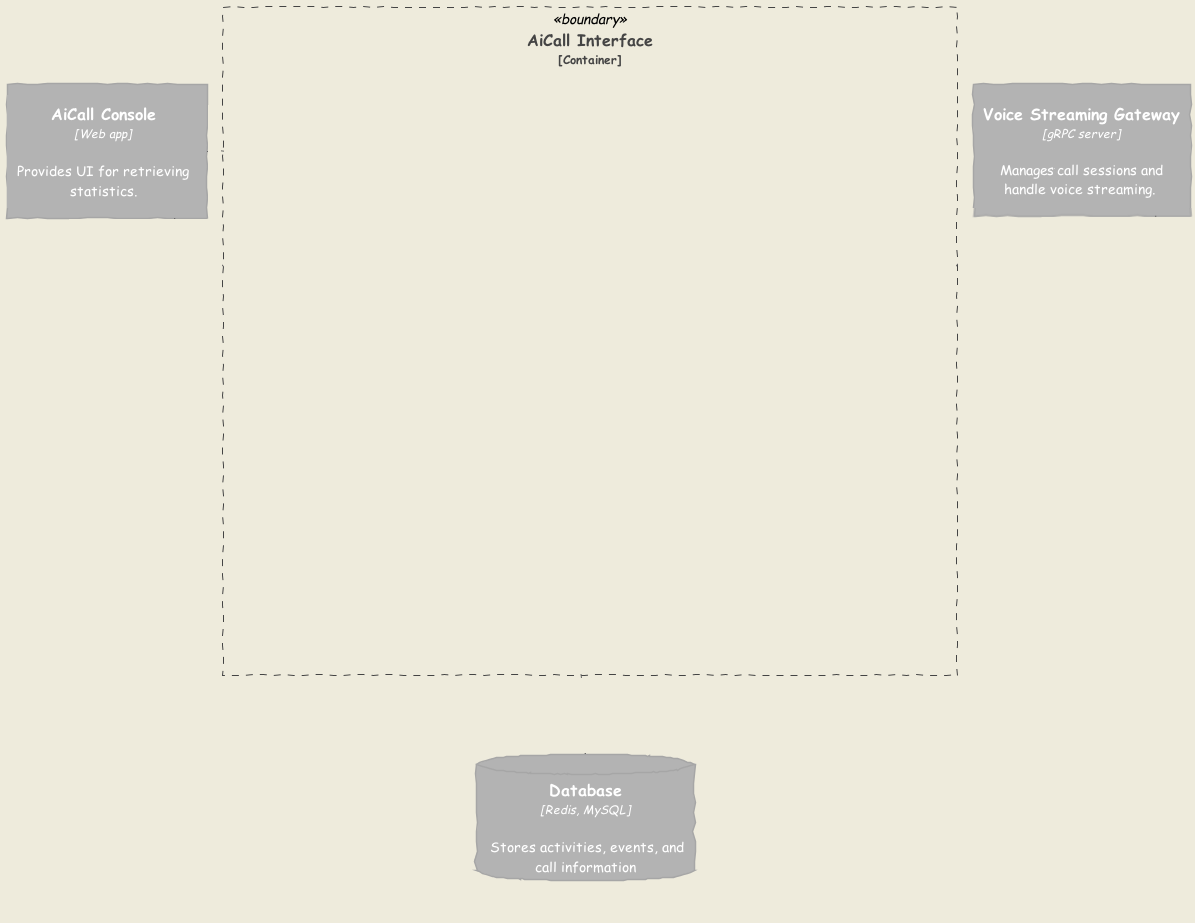
Then, you should list up functional modules as a component of the container and elaborate on their roles and relations with relevant technologies and implementation, giving more information compared to the container diagram. This is how the component diagram of the AiCall interface container looks like.

In the C4 model, code-level diagrams are similar to class diagrams or entity-relation diagrams, which represent very specific implementation. Code-level diagrams can be provided or skipped. Usually, it is not recommended to draw them unless the component is very important or complicated.
We have taken a look at software architecture modeling and drew a diagram with the C4 model. Now, we'll leave the modeling results as an interim output (or in other words, text) for now and take a look at the diagramming tool.
Text-based C4 model diagramming tool, C4-PlantUML
In his session, Avi introduced the C4 model together with a text-based diagramming tool. They are Structurizr, C4-PlantUML, and Kroki. Since Kroki uses C4-PlantUML, Structurizr and C4-PlantUML are the only tools that use the C4 model for diagramming.
Structurizr is a paid service, providing a C4 model diagramming solution, but it provides domain specific language (DSL) for diagramming and CLI commands for building as open source. DSL enables you to create diagrams in various formats with software architecture data. When you dig deeper into its specifications, you can also adjust the layout or style of a diagram as well. This is the strength of Structurizr.
C4-PlantUML is equivalent to a library for PlantUML and comes with extended specifications for C4 model diagramming on top of PlantUML. Unlike Structurizr, C4-PlantUML automatically determines the layout and only provides a fixed set of styles. However, it can be easily applied if you're already using PlantUML and updates are made regularly.
Structurizr and C4-PlantUML create diagrams from text-based data respectively written in DSL format or PlantUML markup. In short, they use the C4 model for software architecture modeling and produce software architecture diagrams in DSL or C4-PlantUML formats.
As of January 2021, my main work tool is Microsoft Visual Studio Code. I chose PlantUML as an illustrating tool for C4 model diagrams because the PlantUML plugin works better than Structurizr and I've been using PlantUML so far. Well, if I were to handle diagram content in formats like YAML to micromanage diagrams or use more universal data, I could shift to Structurizr DSL.
To use C4-PlantUML, you need to clone or download the C4-PlantUML repository and add the following statement at the top of the PlantUML file to load the C4-PlantUML file.
@startuml
!include path/to/C4-PlantUML/C4.puml
...
If you want to use the latest version at all times, you can add the following URI.
@startuml
!include https://raw.githubusercontent.com/plantuml-stdlib/C4-PlantUML/master/C4.puml
...
You can also distinguish the C4.puml, C4_Context.puml, C4_Container.puml, and C4_Component.puml files. I couldn't find an accurate explanation but I assumed it was to avoid loading unnecessary data since diagrams at different levels require a different scope of elements. For example, a legend will only include elements used at the given level, depending on the type of the file. It would be more efficient to load relevant files if you want to create a system context or container diagram.
If you have a general understanding of PlantUML and the C4 model, you'll be able to pick up how-tos including the grammar after reading the readme file on the C4-PlantUML GitHub repository and practicing for about 30 minutes to 1 hour. As you've probably guessed, sample diagrams presented above are created using C4-PlantUML. I'll include the following for your information.
System context example
@startuml

!include ../C4-PlantUML/C4_Context.puml
!define ICONS https://raw.githubusercontent.com/tupadr3/plantuml-icon-font-sprites/master/

!include ICONS/font-awesome-5/users.puml
!include ICONS/font-awesome-5/user_tie.puml
!include ICONS/material/contact_phone.puml

LAYOUT_AS_SKETCH()
LAYOUT_LEFT_RIGHT()
LAYOUT_WITH_LEGEND()

Person_Ext(user, "Clients", "Clients who are using OOO service", "users")
Boundary(new, "Customer service using CLOVA AiCall") {

  Boundary(legacy, "Legacy customer service"){
    System_Ext(cc, "Contact Center", "Contact point, switches customer calls.")
    Person_Ext(counselor, "Customer counselors", "Interacts with customers to handle complaints, process orders, and provide information about OOO service.", "contact_phone")
    System_Ext(ars, "ARS", "Interacts with customers when counselors are not available.")

    Rel(user, cc, "Makes a call")
    Rel(cc, counselor, "Connects and forwards a call to")
    Rel(cc, ars, "Connects and forwards a call to")
  }

  System(ccai, "CLOVA AiCall", "Interacts with customers using CLOVA AI tech.")

  Rel(cc, ccai, "Connects and forwards a call to")

}

Person_Ext(manager, "Manager", "Makes a decision from statistics provided by CLOVA AiCall", "user_tie")
Rel(manager, ccai, "Retrives statistics from")

@enduml
Container example
@startuml

!include ../C4-PlantUML/C4_Container.puml
!define ICONS https://raw.githubusercontent.com/tupadr3/plantuml-icon-font-sprites/master/

!include ICONS/font-awesome-5/user_tie.puml

LAYOUT_AS_SKETCH()
LAYOUT_LEFT_RIGHT()
LAYOUT_WITH_LEGEND()

System_Ext(cc, "Contact Center", "Contact point, switches customer calls.")
Person_Ext(manager, "Manager", "Makes a decision from statistics provided by CLOVA AiCall", "user_tie")

System_Boundary(clova_ai_call, "CLOVA AiCall") {

  Container(pa, "Protocol Adapter", "SIP, gRPC client", "Converts voice streams into supported format.")
  Container(vsg, "Voice Streaming Gateway", "gRPC server", "Manages call sessions and handle voice streaming.")
  Container(cic, "CIC", "CIC Protocol", "Processes AI requests")
  Container(interface, "AiCall Interface", "Kafka, REST API", "Provides interfaces for AiCall console")
  Container(console, "AiCall Console", "Web app", "Provides UI for retrieving statistics.")
  ContainerDb(db, "Database", "Redis, MySQL", "Stores activities, events, and call information")

  Rel(cc, pa, "Forwards voice stream data to", "SIP trunk")
  Rel_L(pa, vsg, "Forwards converted voice stream to", "gRPC call")

  Rel(vsg, cic, "Requests voice recognition and processing corresponding works to", "REST/HTTPS 2.0")
  Rel(vsg, interface, "Sends event log to", "REST API call")
  Rel(manager, console, "Retrieves statistics from", "HTTP")
  Rel(console, interface, "Queries statistic data from", "REST API call")

  Rel_L(interface, db, "Reads from and writes to", "JDBC")
}

@enduml
Component example
@startuml

!include ../C4-PlantUML/C4_Component.puml
!define ICONS https://raw.githubusercontent.com/tupadr3/plantuml-icon-font-sprites/master/

!include ICONS/govicons/user_suit.puml
!include ICONS/font-awesome-5/user_tie.puml
!include ICONS/material/dialer_sip.puml

LAYOUT_AS_SKETCH()
LAYOUT_WITH_LEGEND()

Container_Ext(vsg, "Voice Streaming Gateway", "gRPC server", "Manages call sessions and handle voice streaming.")
Container_Ext(console, "AiCall Console", "Web app", "Provides UI for retrieving statistics.")
ContainerDb_Ext(db, "Database", "Redis, MySQL", "Stores activities, events, and call information")

Container_Boundary(ai_call_interface, "AiCall Interface") {

  Component(signin, "Sign In Controller", "Spring MVC REST Controller", "Allows users to sign in to AiCall Console.")
  Component(query, "Query Controller", "Spring MVC REST Controller", "Allows users to Retrieves statistics data with query.")
  Component(log, "Event Log Controller", "Spring MVC REST Controller", "Allows other components to store their events logs to DB.")
  Component(auth, "Auth Component", "Spring Bean", "Provides functionality related to authentication")
  Component(db_control, "DB Controller", "Spring Bean", "Provides functionality related to DB access.")

}

Rel(vsg, log, "Makes API calls to", "JSON/HTTPS")
Rel_R(console, signin, "Makes API calls to", "JSON/HTTPS")
Rel_R(console, query, "Makes API calls to", "JSON/HTTPS")
Rel(signin, auth, "Uses")
Rel(query, db_control, "Uses")
Rel(log, db_control, "Uses")
Rel(auth, db_control, "Uses")
Rel(auth, db_control, "Uses")
Rel(db_control, db, "Reads from and writes to", "JDBC")

@enduml
Wrap-up
I've covered many topics so far and now it's time to wrap up. At a glance, you might think that my blog post can assist you when drawing diagrams for formal and specialized documents only and it wouldn't help much with day-to-day work. But, if you stop and think for a moment, we often use diagrams for other purposes in addition to documentation. For instance, we rely on diagrams when we're sharing our thoughts and discussing about software with our colleagues, when we give an overall view of architecture to external partners or when a new member joins our team. I've witnessed many people drawing diagrams on a piece of paper or whiteboard during a meeting or conversion and taking a picture to share them through collaboration tools like wikis.
Why do we use diagrams so often in our day-to-day work? As mentioned in the recently published blog post (link in Korean), one reason is that we are not fully comfortable with writing. But, more so, diagrams are a great tool to intuitively deliver the story. What if you can do a better job with the C4 model than a hand-drawn diagram without learning complicated theories and rules of the 4+1 architecture view or UML? It might not be as fast as drawing diagrams by hand, but it will be clearer and provide a well-structured software architecture diagram for future collaboration.
I've introduced the C4 model and C4-PlantUML for software architecture diagrams. As we ushered in the new year, you're probably busy starting a new project or welcoming newcomers. I'm sure you will have a lot of chances to draw diagrams. I sincerely hope what I've introduced in this post can be helpful when you're sharing your work and thoughts with your colleagues.
- Architectural view: As the architecture of a building can be described from different angles with location plans, elevation, side views and aerial views, software architecture can be described from the viewpoint of different stakeholders. It is a view model for the software architecture.