
macOS 메뉴바 활용
저는 LINE Fukuoka의 개발 팀에서 일하는 Paul Traylor입니다. LINE에 처음 입사했을 때부터 저의 주요 업무는 Prometheus 및 Grafana를 활용하여 내부 서버를 모니터링하는 시스템을 보기 쉽게 만드는 것이었습니다. 그리고 최종 목표는 개발자가 본인만의 알림을 수월하게 설정할 수 있도록 하는 것입니다. 저는 모니터링 시스템을 관리하는 일을 담당하기 때문에 여러 다른 환경에 구축된 다양한 차트를 살펴보고 여러 서버들을 검사해야 합니다. 무엇보다 모든 부분을 일일이 살펴보는 것이 점점 어려워지고 있기 때문에 모니터링을 보다 수월하게 처리할 수 있는 간단한 툴을 찾아보곤 합니다. 그중에 제가 선호하는 툴은 BitBar입니다. 이 툴로 간단한 상태 플러그인을 만들면 제가 생각했던 대부분을 모니터링할 수 있습니다.
Python에서 플러그인 구현
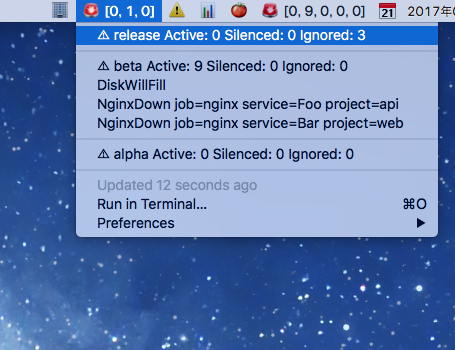
BitBar의 핵심은 스크립트에서 출력된 결과를 가져와 커스텀 메뉴에 표시하는 것입니다. 저희가 원하는 것은 위 스크린샷처럼 메뉴바에는 현재의 알림 상태를 보여주는 스냅샷을 표시하고 이 부분을 클릭하면 현재 환경에 대한 자세한 정보를 표시하는 것입니다. 서로 다른 여러 환경들을 모니터링해야 하기 때문에 스크립트가 각 환경을 일일이 체크할 수 있어야 하고 설정 정보는 스크립트 외부에 저장할 수 있어야 합니다.
BitBar에서 처리하는 출력 결과 예시
:rotating_light: [0, 1, 0]
---
:warning: release Active: 0 Silenced: 0 Ignored: 3 | href=http://release.alertmanager.example/

---
:warning: beta Active: 3 Silenced: 0 Ignored: 0| href=http://beta.alertmanager.example/
DiskWillFill | href=http://beta.prometheus.example/<alert>
NginxDown job=nginx service=Foo project=api | href=http://beta.prometheus.example/<alert>
NginxDown job=nginx service=Bar project=web | href=http://beta.prometheus.example/<alert>
---
:warning: alpha Active: 0 Silenced: 0 Ignored: 0| href=http://alpha.alertmanager.example/
이것은 제가 플러그인에 주로 사용하는 기본 헤더입니다. Python 3로 테스트할 때 Unicode 이슈가 종종 있어서 이런 방법을 통해 UTF-8에서 stdout으로 출력하게 만들었습니다. BitBar 플러그인은 단지 스크립트이기 때문에 대부분의 개발 작업은 콘솔에서 하는 편입니다. 그래서 콘솔에서 실행할 때는 추가 정보를 stderr로 출력하는 것을 선호합니다.
기본 헤더
#!/usr/local/bin/python3
import collections
import configparser
import logging
import os
import sys

import requests


if 'BitBar' in os.environ:
    logging.basicConfig(level=logging.WARNING)
    sys.stdout = open(sys.stdout.fileno(), mode='w', encoding='utf8')
else:
    logging.basicConfig(level=logging.DEBUG)
logger = logging.getLogger(__name__)
저는 많은 환경을 모니터링하기 때문에 설정 정보를 별도의 위치에 저장해 두고 다양한 환경의 모니터링을 간편하게 설정할 수 있어야 합니다. 기본적인 Python ConfigParser를 사용하면 내 설정 정보를 쉽게 저장할 수 있습니다.
설정 파일 예시
[release]
url = http://release.example.com

[beta]
url = http://beta.example.com

[alpha]
url = http://alpha.example.com
config 로딩 및 기본 bucket 설정
# Load our config file. I try to follow standards as much as possible, so I save my
# settings using the XDG Base Directory Specification
config = configparser.ConfigParser()
config.read([os.path.expanduser('~/.config/bitbar/alertmanager.ini')])
environments = [(section, config.get(section, 'url')) for section in config.sections()]

# Setup a bucket to hold our per-environment alerts
alerts = collections.defaultdict(list)
# and setup some counters
silenced = collections.defaultdict(int)
ignored = collections.defaultdict(int)
Alert Manager에서 쿼리 실행
# Start by looping through each of our environments and query
# the correct Alertmanager from our configuration file.
# If we have an error while querying a server, we'll just skip it for now
# (we're probably getting email alerts for it anyways)
# I also like to add a custom user-agent to help with
# debugging where a request comes from
for env, url in environments:
    try:
        result = requests.get(
            '{}/api/v1/alerts/groups'.format(url),
            headers={'user-agent': USER_AGENT}
        )
        result.raise_for_status()
    except:
        logger.error('Error querying server %s', env)
        continue
BitBar로 처리할 출력 생성
# A small helper function to handle formatting the labels from Alertmanager
def label(alert, label):
   if label in alert['labels']:
       if alert['labels'][label]:
           return ' {}={}'.format(label, alert['labels'][label])
   return ''

# Loop through each entry from Alertmanager, and build a list of our alerts
for entry in data:
   if entry['blocks']:
       for block in entry['blocks']:
           for alert in block.get('alerts', []):
               # I don't really care to see silenced alerts, so I'll skip those
               # and only show them in the total count
               if 'silenced' in alert:
                   logger.debug('Skipping silenced alert %s', alert['labels'])
                   silenced[env] += 1
                   continue
               # I've been testing some heartbeat checks to ensure that
               # prometheus is running well, so I want to skip my heartbeat
               # checks from the output as well
               if 'heartbeat' == alert['labels'].get('severity'):
                   logger.debug('Skipping heartbeat alert %s', alert['labels'])
                   ignored[env] += 1
                   continue
               # We want to start each of our lines with the actual alert name
               # being fired
               _buffer = alert['labels']['alertname']
               # And add to that a few specific Prometheus labels that we are
               # interested in
               _buffer += label(alert, 'job')
               _buffer += label(alert, 'service')
               _buffer += label(alert, 'project')
               _buffer += ' | '
               # And if we have the generatorURL (from Prometheus) then we
               # want to allow directly linking to the query itself
               if 'generatorURL' in alert:
                   _buffer += 'href=' + alert['generatorURL']
               alerts[env].append(_buffer)
최종 출력
# Once we have processed all of our alerts from each instance of Alertmanager
# we are ready to build the actual output that will be rendered by BitBar

# We start with an Emoji of a rotating light, and then a quick formatting of
# the active alerts across each of our environments
print(':rotating_light: {}'.format(
   [len(alerts[env[0]]) for env in environments]
))

# We then loop through each of our environments
for env, url in environments:
   print('---')
   # and we print a basic summary of that Alertmanager
   print(':warning: {} Active: {} Silenced: {} Ignored: {}| href={}'.format(
       env, len(alerts[env]), silenced[env], ignored[env], url
   ))

   # And then loop through to show all the alerts. When we mess up and have
   # a LOT of messages from Alertmanager, we will only show a limited number
   # so that we do not make our MenuBar unreadable
   if len(alerts[env]) > MAX_SHOW:
       print(':bomb: Truncated error list to %s' % MAX_SHOW)
   print(u'
'.join(sorted(alerts[env][:MAX_SHOW])))
마치며
BitBar는 어떤 스크립트라도 메뉴바 플러그인으로 변환할 수 있기 때문에 다양한 모니터링을 수행하는 스크립트를 쉽게 작성할 수 있습니다. 예를 들어, 검토를 기다리는 GitHub 풀리퀘스트가 있는지 모니터링하는 스크립트를 만들 수도 있습니다.
이 블로그에 소개된 BitBar 플러그인을 직접 사용해 보고 싶다면 아래 GitHub 리포지터리를 확인해주시기 바랍니다.