
Taking advantage of the menu bar on macOS
I'm Paul Traylor from LINE Fukuoka's development team. Since starting at LINE, my primary responsibility has been working with Prometheus and Grafana to update our internal server monitoring system into something that is easier to use. The end goal is to make it possible for developers to easily set their own alerts. Since I'm in charge of monitoring the monitoring system, I often have to look at many different charts and check servers from several different environments. As it gets quite difficult to keep an eye on everything, I like to find small tools that make that easier. One of my favorites to work with is a tool called BitBar, which allows me to build simple status plugins to observe anything that I can think of.
Implementing a plugin in Python
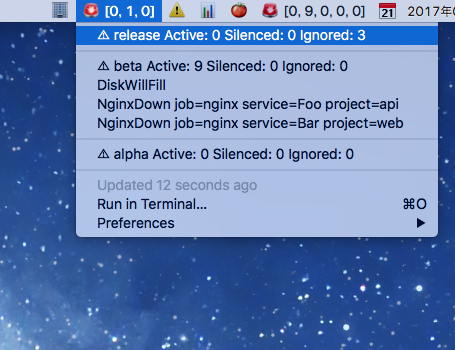
At its core, BitBar works by taking the formatted output from a script and using it to display a custom menu. As in the above screenshot, we want the menu bar to show a quick snapshot of the active alerts, and when clicking it, show a detailed summary of the current environments. Since I monitor multiple different environments, I want to make sure my script can loop through each environment and store the settings outside of the script itself.
Example output to be processed by BitBar
:rotating_light: [0, 1, 0]
---
:warning: release Active: 0 Silenced: 0 Ignored: 3 | href=http://release.alertmanager.example/

---
:warning: beta Active: 3 Silenced: 0 Ignored: 0| href=http://beta.alertmanager.example/
DiskWillFill | href=http://beta.prometheus.example/<alert>
NginxDown job=nginx service=Foo project=api | href=http://beta.prometheus.example/<alert>
NginxDown job=nginx service=Bar project=web | href=http://beta.prometheus.example/<alert>
---
:warning: alpha Active: 0 Silenced: 0 Ignored: 0| href=http://alpha.alertmanager.example/
This is the basic header I tend to use with most of my plugins. In testing with Python 3, I would occasionally have issues with Unicode, so I use this trick to ensure that stdout properly uses UTF-8. Since BitBar plugins are just scripts, I tend to do most of my development in the console, so if I'm running in the console, I would like to have additional information printed to stderr.
Basic header
#!/usr/local/bin/python3
import collections
import configparser
import logging
import os
import sys

import requests


if 'BitBar' in os.environ:
    logging.basicConfig(level=logging.WARNING)
    sys.stdout = open(sys.stdout.fileno(), mode='w', encoding='utf8')
else:
    logging.basicConfig(level=logging.DEBUG)
logger = logging.getLogger(__name__)
Since I'm monitoring multiple environments, I want to store the settings somewhere that's easy to configure to monitor various environments. Using the default Python ConfigParser, I can store my settings easily.
Example settings file
[release]
url = http://release.example.com

[beta]
url = http://beta.example.com

[alpha]
url = http://alpha.example.com
Loading config and setting up default buckets
# Load our config file. I try to follow standards as much as possible, so I save my
# settings using the XDG Base Directory Specification
config = configparser.ConfigParser()
config.read([os.path.expanduser('~/.config/bitbar/alertmanager.ini')])
environments = [(section, config.get(section, 'url')) for section in config.sections()]

# Setup a bucket to hold our per-environment alerts
alerts = collections.defaultdict(list)
# and setup some counters
silenced = collections.defaultdict(int)
ignored = collections.defaultdict(int)
Querying from Alert Manager
# Start by looping through each of our environments and query
# the correct Alertmanager from our configuration file.
# If we have an error while querying a server, we'll just skip it for now
# (we're probably getting email alerts for it anyways)
# I also like to add a custom user-agent to help with
# debugging where a request comes from
for env, url in environments:
    try:
        result = requests.get(
            '{}/api/v1/alerts/groups'.format(url),
            headers={'user-agent': USER_AGENT}
        )
        result.raise_for_status()
    except:
        logger.error('Error querying server %s', env)
        continue
Building our output for BitBar
# A small helper function to handle formatting the labels from Alertmanager
def label(alert, label):
   if label in alert['labels']:
       if alert['labels'][label]:
           return ' {}={}'.format(label, alert['labels'][label])
   return ''

# Loop through each entry from Alertmanager, and build a list of our alerts
for entry in data:
   if entry['blocks']:
       for block in entry['blocks']:
           for alert in block.get('alerts', []):
               # I don't really care to see silenced alerts, so I'll skip those
               # and only show them in the total count
               if 'silenced' in alert:
                   logger.debug('Skipping silenced alert %s', alert['labels'])
                   silenced[env] += 1
                   continue
               # I've been testing some heartbeat checks to ensure that
               # prometheus is running well, so I want to skip my heartbeat
               # checks from the output as well
               if 'heartbeat' == alert['labels'].get('severity'):
                   logger.debug('Skipping heartbeat alert %s', alert['labels'])
                   ignored[env] += 1
                   continue
               # We want to start each of our lines with the actual alert name
               # being fired
               _buffer = alert['labels']['alertname']
               # And add to that a few specific Prometheus labels that we are
               # interested in
               _buffer += label(alert, 'job')
               _buffer += label(alert, 'service')
               _buffer += label(alert, 'project')
               _buffer += ' | '
               # And if we have the generatorURL (from Prometheus) then we
               # want to allow directly linking to the query itself
               if 'generatorURL' in alert:
                   _buffer += 'href=' + alert['generatorURL']
               alerts[env].append(_buffer)
Final output
# Once we have processed all of our alerts from each instance of Alertmanager
# we are ready to build the actual output that will be rendered by BitBar

# We start with an Emoji of a rotating light, and then a quick formatting of
# the active alerts across each of our environments
print(':rotating_light: {}'.format(
   [len(alerts[env[0]]) for env in environments]
))

# We then loop through each of our environments
for env, url in environments:
   print('---')
   # and we print a basic summary of that Alertmanager
   print(':warning: {} Active: {} Silenced: {} Ignored: {}| href={}'.format(
       env, len(alerts[env]), silenced[env], ignored[env], url
   ))

   # And then loop through to show all the alerts. When we mess up and have
   # a LOT of messages from Alertmanager, we will only show a limited number
   # so that we do not make our MenuBar unreadable
   if len(alerts[env]) > MAX_SHOW:
       print(':bomb: Truncated error list to %s' % MAX_SHOW)
   print(u'
'.join(sorted(alerts[env][:MAX_SHOW])))
Closing words
Since BitBar can turn any script into a menu bar plugin, we can easily write scripts to monitor a number of things. For example, we can write a BitBar script that monitors GitHub pull requests waiting for review.
If you'd like to try the BitBar plugin presented in this article for yourself, please visit the GitHub repository below.