I'm Paul Traylor with LINE Fukuoka's Development Department where I focus on monitoring many servers used to support LINE Family Apps.
For most developers, it's much more fun to focus on code and adding new features but when things are running poorly it's useful to know why. Since it's sometimes difficult to configure monitoring by yourself, it has been my responsibility to make it easier to use so that all services can be monitored for peak performance. As part of this, we developed Promgen to help maintain our Prometheus configuration and make it easier for developers to register monitoring targets or subscribe to alerts for any service they are responsible for.
Configuring Monitoring
While most services start off small and simple, over time they can grow to include dozens of different components spread over hundreds of servers. Since it can be difficult to configure monitoring, Promgen was developed to put all the settings in one place and give you a quick overview at a glance.

In order to make things as easy as possible for developers, we tried to make an action executable with a single button for all the actions developers would want to perform, from registering new monitoring targets to silencing a noisy server that is undergoing maintenance, or even just testing to make sure that the target is up and running.
Configuring Notifications
Once all of your monitoring targets are registered, we want to be notified when something is not running properly. I prefer to use LINE Notify to receive alerts, but we also have a built-in support for getting email notifications. With Promgen, we make it easy for a developer to find their project, and configure their preferred notifications with a few clicks.
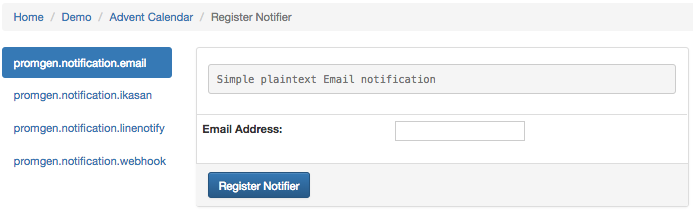
Here we can easily configure notification settings to email and LINE Notify so that when an alert comes in for a service I'm in charge of, I'd know about it.
Configuring Alert Rules
Prometheus supports it's own query language called PromQL which provides many different functions and operators that can be used for exploring metrics.
For example, the rate() function can be commonly used to watch how quickly a value is changing.
# See the rate of alerts received over the past 5 minutes
rate(alertmanager_alerts_received_total[5m])
Or I may use an operator like max() or avg() and group the results by a service or a project.
# For each Prometheus instance I have running, take the max timestamp
# and the min timestamp and group the result by project to see if the drift
# between servers in our shard is more than 120 seconds apart
max(prometheus_config_last_reload_success_timestamp_seconds{job="prometheus"}) BY (project)
  -
min(prometheus_config_last_reload_success_timestamp_seconds{job="prometheus"}) BY (project)
> 120
We can also use a function like time() to compare timestamps to see if a job is running late or it's time to renew certificates.
# Let me know if any of our SSL certificates are going to expire within the next 30 days
probe_ssl_earliest_cert_expiry{job="blackbox"} - time() < 86400 * 30
One challenge when using Prometheus is writing alert rules that are general enough to use across many services but not so specific to cause unnecessary alerts. If I'm running a Hadoop service, I want to be using as much CPU as possible so I generally do not want to hear the default CPU load alarms. If I'm running a file storage node that grows at a known rate, then maybe I want to be notified when 10GB are remaining instead of at 80% usage. It can be difficult to write general rules for memory usage or disk usage that cover all kinds of services. We want to be able to set reasonably general rules that cover most cases, but also override those for specific services when necessary..
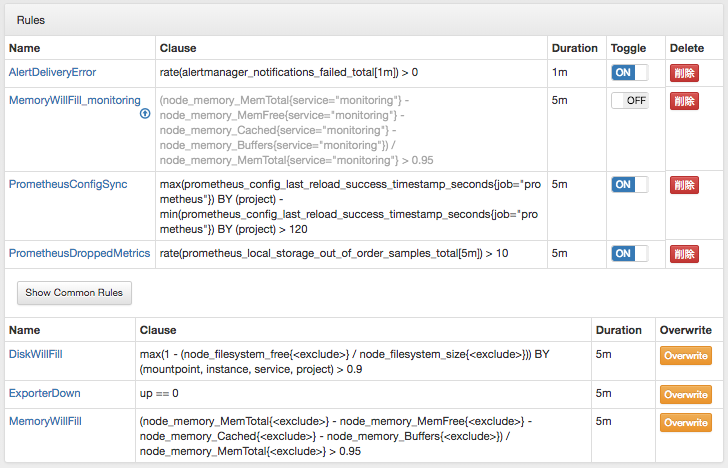
By implementing a macro in Promgen, we can expand some of our more dynamic rules when we render a Prometheus rule file.
- We have a parent rule that covers our basic defaults but we add the
<exclude>macro that is Promgen specific. - For a child service or a child project, click the Overwrite button to make a copy of our rule that we can edit for our specific service.
- When Promgen renders our rules, it will fill in our
<exclude>macro with a matcher that excludes all child rules from the parent matcher.
# Our child rule is written to only query the specific service we want to
# override
node_load1{service="monitoring"} > 50
# Our parent rule is now re-written to query everything except children
# with their specific overrides
node_load1{service!~"monitoring|hadoop"} > 30
If we decide we don't want to hear an alert at all, we can always create an override (so that the parent excludes our service) but then leave the rule itself disabled (so that it is not sent to the Prometheus server).
Operating Prometheus
As the number of developers using Prometheus has increased within LINE, we have needed to increase the number of Prometheus servers to keep up. Prometheus is intentionally kept simple to allow it to scale better and does not share anything across servers by design. For high availability, we typically run each Prometheus server paired with an identical server, and then we split our monitoring targets across several of these pairs to allow us to monitor several thousand targets and collect several million samples each interval.
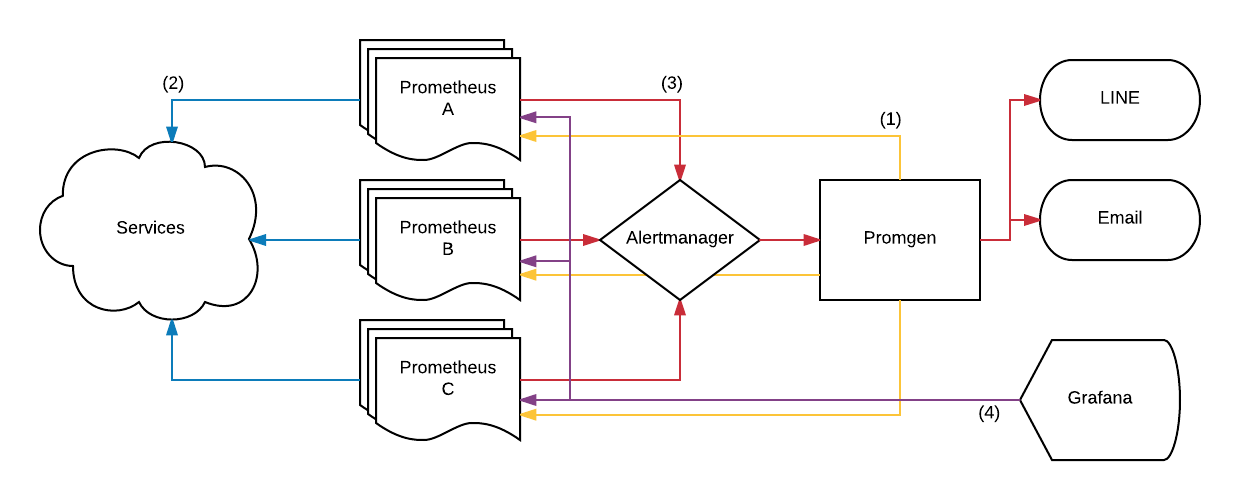
- Promgen is used to manage the configuration for all of our Prometheus servers.
- Prometheus scrapes targets and records metrics.
- When Alerts are fired, they are routed through the Alertmanager to handle duplicates before routing to LINE Notify or email via Promgen.
- Developers can open Grafana directly from their notification to diagnose the problem.
Dealing with Mistakes in Instrumentation
Compared to other monitoring solutions, Prometheus can track thousands of different metrics per target, and its query language provides a powerful way to query different slices of one's infrastructure. Because Prometheus is so powerful, it can be easy to make a mistake when instrumenting your own application.
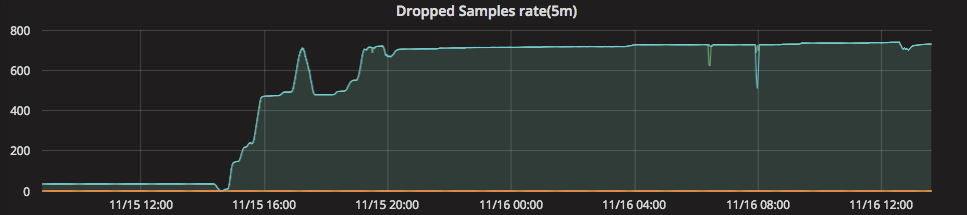
rate(prometheus_local_storage_out_of_order_samples_total[5m]) > 10
While Prometheus is not directly affected (Prometheus just drops the metric) the developer may be surprised to find some of their data missing. Since we are running Prometheus as a service for others to use, we want to make things as easy as possible and avoid mistakes. We provide a second testing environment for developers to use, so they can easily catch problems and fix them before they deploy a new version of their services. We have several rules like this setup to watch Prometheus itself, so that we can help developers catch things quicker.
Future Plans
Prometheus is very powerful which results in a high learning curve when getting started. There are also many things that need to be configured, from the list of targets to monitor to where to send alert messages. Even though Promgen targets developers as users, it can be difficult to develop a user interface that is easy to understand. I hope to continue to improve Promgen and make it even easier for more developers to start monitoring their services.