
Performance tests are a necessary and crucial part of all services in LINE, which ensures that software applications will perform well under the expected workload. Whenever features which may affect overall user experience are implemented, performance testing is executed as a part of the testing plan.
But setting up and maintaining a performance test environment is not always easy and efficient, reasons are listed as below:
- Server load criteria varies between features, component, and events
- According to different performance criteria of features implemented on different components or sometimes event scales, the RPS (request per second) varies a lot. And most open source performance tools do not have features to control multiple test executors and help you to consolidate reports from each of them. Thus testers needs to perform steps manually and multiple try runs to find out the right scale machine to run the performance test scripts. These steps require allocating new machines, installing necessary libraries, uploading scripts, and doing some try runs to make sure scripts can generate necessary workloads without over exhausting the test machine itself.
- Each service or team maintains its own performance test environment
- Due to the reasons such as workload criteria and release schedule, each team or service here in Taiwan maintain their own set of performance test environments, which includes some workload machines, an Influx DB, and Grafana dashboard machines. These servers are quite identical in functionalities but the setting up and maintaining a set of these servers by each team is very cumbersome and not very good for the developer experience.
- Machine utilization is very low
- Large scale performance tests like these are not required to be executed frequently and most of the time are considered when new features are implemented or there are changes to architecture. Each team having their own set of servers allocated for these infrequent workloads makes server utilization very low, but still it requires maintenance resources from time to time.
- Lack of a centralized monitoring dashboard
- Performance tests require monitoring test executor resources and server sides resources all together at the same time. In the past, an engineer would open multiple terminal consoles in a desktop window and issues commands to monitor CPU, memory, disk, and network IO from there. These are not convenient to setup nor easy to preserve records from test executions.
So, in the following sections, we are going to show you how to leverage dynamic resource management from the Jenkins Kubernetes plugin to solve the problems highlighted above.
In LINE Taiwan, most of the time we use k6 as our load testing tool, so the setup below is based on this scenario, but should be the same for other tools as well.
Architecture diagram
The idea here is to prepare a platform that uses the Kubernetes plugin for Jenkins which allows each team to run their performance (k6) test scripts without worrying about underlying infrastructure setup and maintenance.
The platform can evenly distribute workloads across all available nodes in the cluster to better simulate real-world scenarios without stressing computing resources and network bandwidth on a single machine.

For each team that wants to use the platform, the following attributes are provided as necessary:
- POD_COUNT: How many Pods do you want to run your workload?
- GIT_RAW_FILE: Your k6 performance script in raw format in your version control server
- DURATION and VIRTUAL_USER: Check the definition of duration and VUs in the official k6 documentation
- INFLUX_DB: The URL to your InfluxDB where load testing data is hosted (better to set up one server for all teams)

Performance test platform resources
Git repository resources
To make this work, we need to prepare a Jenkins pipeline (jenkinsfile) and a PodTemplate to instruct Kubernetes plugin for Jenkins to provision the workload resources.
KubernetesPod.yaml
apiVersion: v1
kind: Pod
metadata:
  name: k6node ## since this file is cached as Jenkins node template, change this name when below attributes are updated, otherwise it will keep using old ones!!! Need to update Jenkinsfile also.
  labels:
    app: k6
spec:
  namespace: default
  affinity:
    podAntiAffinity:
      preferredDuringSchedulingIgnoredDuringExecution:
      - weight: 100
        podAffinityTerm:
          namespace: default
          topologyKey: kubernetes.io/hostname
          labelSelector:
            matchExpressions:
              - key: app
                operator: In
                values:
                  - k6
                  - k6node
  containers:
  - name: k6
    image: your.docker_registry.com/your_org/k6:your_image_version
    resources:
      requests:
          cpu: "100m"
          memory: "256Mi"
    tty: true
    securityContext: ## <-- When define USER in Dockerfile, securityContext should be added with root user, so that shell script will not hang in container
      runAsUser: 0
Jenkinsfile
pipeline {
  parameters {
    string(name: 'POD_COUNT', defaultValue: '2', description: 'number of Pods runs k6 scripts')
    string(name: 'GIT_RAW_FILE', defaultValue: 'https://raw.githubusercontent.com/loadimpact/k6/master/samples/http_get.js', description: 'raw file of the k6 performance script in git')
    string(name: 'DURATION', defaultValue: '5m', description: 'this will overwrite duration value in script')
    string(name: 'VIRTUAL_USER', defaultValue: '10', description: 'this will overwrite VUs value in script')
    string(name: 'INFLUX_DB', defaultValue: 'http://your_influxDB_IP:_PORT/your_influxDB_name', description: 'change the influx URL or DB name as you wish')
  }
  environment {
    GIT_TOKEN = credentials('github-token')
  }
  agent {
    kubernetes {
      label 'k6node'
      yamlFile 'KubernetesPod.yaml'
    }
  }
  stages {
    stage('Performance Test') {
      steps {
        script {
          def stages = [: ]
          echo "Pods count: ${params.POD_COUNT}"
          echo "VUs: ${params.VIRTUAL_USER}"
          echo "Duration: ${params.DURATION}"
          for (int i = 0; i < params.POD_COUNT.toInteger(); i++) {
            stages[i] = {
              node('k6node') {
                stage("Stage-${i}") {
                  container('k6') {
                    sh "wget --header='Authorization: token $GIT_TOKEN' --header='Accept: application/vnd.github.v3.raw' ${params.GIT_RAW_FILE} --output-document=pt.js"
                    sh "k6 run pt.js --duration ${params.DURATION} --vus ${params.VIRTUAL_USER} --out influxdb=${params.INFLUX_DB}"
                  }
                }
              }
            }
          }
          parallel stages
        }
      }
    }
  }
}
Dockerfile
FROM golang:1.14-alpine as builder
WORKDIR $GOPATH/src/github.com/loadimpact/k6
ADD . .
RUN apk --no-cache add git
RUN CGO_ENABLED=0 go install -a -trimpath -ldflags "-s -w -X github.com/loadimpact/k6/lib/consts.VersionDetails=$(date -u +"%FT%T%z")/$(git describe --always --long --dirty)"

FROM alpine:3.11
RUN apk add --no-cache ca-certificates &&
    adduser -D -u 12345 -g 12345 k6
COPY --from=builder /go/bin/k6 /usr/bin/k6

USER 12345
Verification
We can check this from k9s (Kubernetes management console) to see how workloads are provisioned, and we can see that Pods are evenly distributed across all available nodes as seen in the screenshot below.

You can verify each pod is running the k6 script by attaching into the shell of the k6 container and checking the standard output.
Docker console
/ # ps -ef
PID USER TIME COMMAND
1 root 0:00 /bin/sh
14 root 0:00 sh -c ({ while [ -d '/home/jenkins/agent/workspace/pt_job_name@tmp/durable-7cf10e10' -a ! -f '/home/jenkins/agent/workspace/pt_job_name@tmp/durable-7cf10e10/jenkins-result.txt' ]; do touch '/home/jenkins/age
15 root 0:00 sh -xe /home/jenkins/agent/workspace/pt_job_name@tmp/durable-7cf10e10/script.sh
18 root 0:56 k6 run https://raw.githubusercontent.com/loadimpact/k6/master/samples/http_get.js --duration 25m --out influxdb=http://influxDB_IP:PORT/myk6db
622 root 0:00 sh
632 root 0:00 sleep 3
633 root 0:00 ps -ef
/ # tail -f /proc/18/fd/1
running (15m25.9s), 10/10 VUs, 1191 complete and 0 interrupted iterations
default [ 62% ] 10 VUs 15m25.9s/25m0s

time="2020-11-30T07:38:15Z" level=info msg="{"_csrf":"vanOzuma-44CvDHIcLmlUdvZmGnToUVFioJ4","payload":{"email":"user5@gmail.com","password":"*******","_csrf":"vanOzuma-44CvDHIcLmlUdvZmGnToUVFioJ4"},"prods":["5f87f24002ed26b65ffd9005","5f87f24002ed26b65ffd9006","5f87f24002ed26b65ffd9008","5f87f24002ed26b65ffd9004","5f87f24002ed26b65ffd9007","5f87f24002ed26b65ffd9003"]}" source=console
time="2020-11-30T07:38:15Z" level=info msg="{"prods":

....
Monitoring dashboard for k6 and node resources
For running performance or stress tests, you will need to monitor Pod/node resources on both client side (k6 workloads) and server side (applications).
Since all workloads are running in Kubernetes, it's easy to plot node and Pod resource graphs along with the k6 performance dashboard in a single Grafana centralized dashboard. The details are listed below.
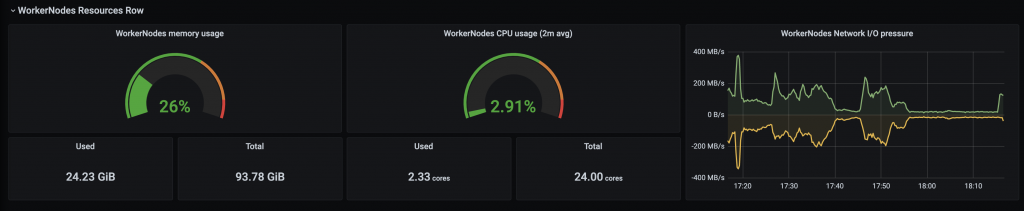
For Pod/node resources:
Below is a screenshot of the monitoring dashboard for Pod and node resource metrics, which are available from most Kubernetes deployments and stored in Prometheus.
For k6 performance dashboard:
To show K6 testing metrics on Grafana dashboards:
- Add datasource into Grafana instance:
- From the left-hand sidebar on Grafana, select Configuration → Data Source → click the Add data source button.
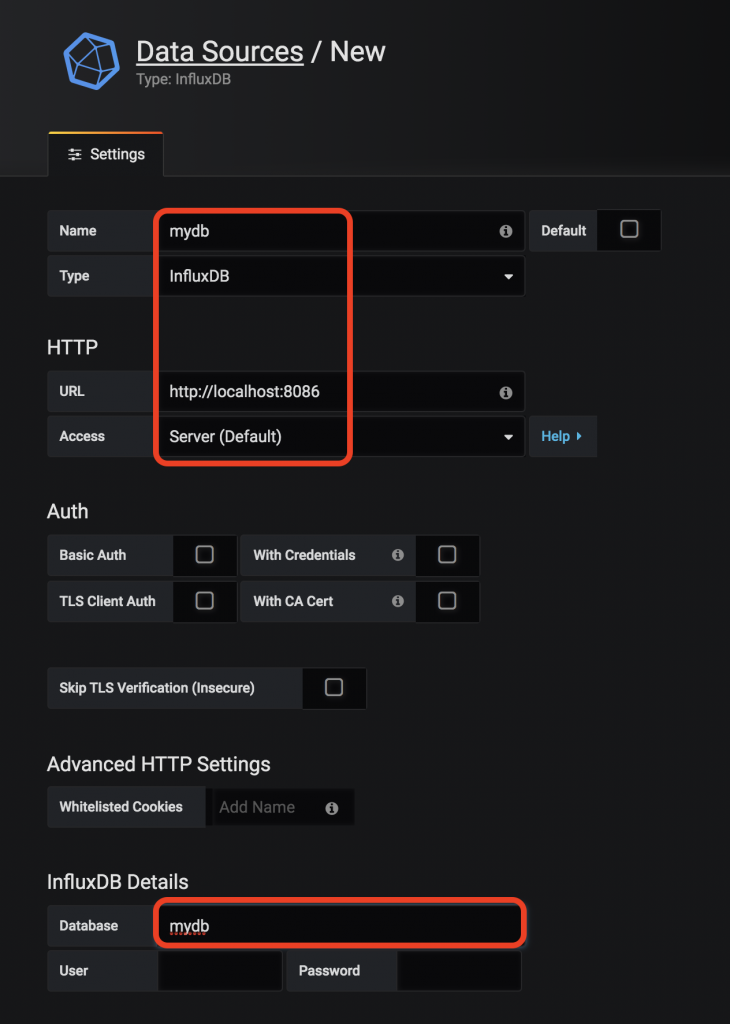
- In the Data Sources / New page, fill in your DB name and select type "InfluxDB"
- In the HTTP section, fill in your InfluxDB instance URL
- In the InfluxDB Details section, fill in your DB name in the Database field (Note the Database name should be the same with the INFLUX_DB name)
- Import k6 load testing dashboard:
- From the left-hand sidebar on Grafana, click + → Import
- Check the k6 Load Testing Result board and click the Copy ID to Clipboard button on the right-hand side.
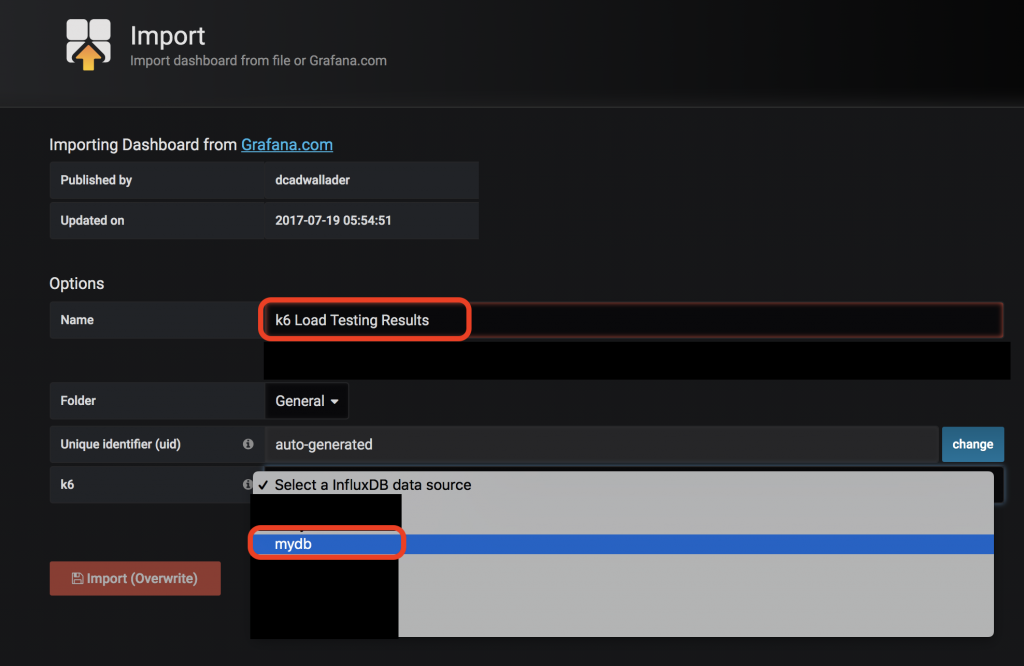
- Paste the ID into the Import via grafana.com field and click Load. The dashboard should be imported successfully (You can change the name of the dashboard later).
- Select the InfluxDB name from the dropdown list
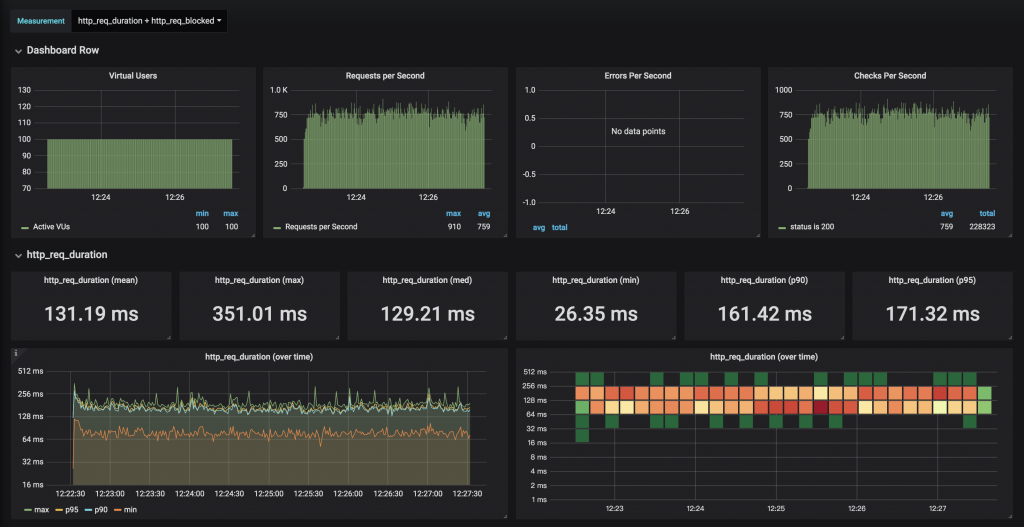
- Click Import
After the performance test runs, you should be able to see the dashboard plotted with the collected metrics.
Summary
By dynamically increasing the Pod and node numbers, we can easily achieve horizontal and vertical scaling for this environment which satisfies different load and usage scenarios from each team.
And most of all, this removes the hassles involved for each team when building and managing their performance testing environments and it also boosts machine utilization rate.
After our teams have moved toward the Kubernetes platform, we've began to consolidate computing resources in both dev and testing areas and hope our experiences proves to be useful to you!