
In this blog post, I would like to talk about the development of monitorable applications with Prometheus. I will also introduce one of the personal projects I work on in my free time which can help with the development of such applications - Metricat.
Observability
Observability has become one of the essential characteristics of modern software systems. There are three main observability concepts - monitoring, tracing, and logging. Monitoring allows developers to see various metrics of a system both in real-time and in retrospect to help with decision-making during maintenance and outage handling.
There are many monitoring platforms available. They can be divided into two categories: push-based and pull-based systems. Applications that use push-based monitoring systems define the timing of each metric submission. The monitoring system accepts metrics and records them. Those using pull-based systems simply expose endpoints and whenever requested by the monitoring system, reply with a set of metrics in the specific format.

In my team, we use pull-based monitoring with a very popular open-source Prometheus-Grafana stack for metrics collection and visualization.
Prometheus is a monitoring system that has its own built-in Time Series Database (TSDB) that scales well allowing to collect metrics from thousands of endpoints. It supports powerful query language PromQL and various integrations with other systems.
Grafana is a data visualization application that can query Prometheus and allows developers to create beautiful dashboards based on collected data.
Monitoring with Prometheus
Prometheus as a pull-based system manages a list of endpoints that needs to be scraped periodically. This list can be static or automatically updated with service discovery systems. One of the tools that can help with that is Promgen, generator of Prometheus configuration files with a web interface developed in LINE as an open-source project.
Using the list of endpoints Prometheus scrapes metrics and stores it in the internal time-series database. Stored metrics can be queried directly using API or visualized with Grafana dashboards.

One of the advantages of the Prometheus platform is a variety of ready to use exporters for popular systems, such as databases, issue trackers, networking solutions, and many more. Some exporters work as plugins and some run next to the actual object of monitoring. A full list of officially supported exporters can be found in the Prometheus documentation for exporters and integrations. We often use JMX, NGINX, and Node exporters for each host which proved to be enough to investigate system-level problems.
Prometheus data export format
Prometheus expects all exporters to follow one very specific format. Early versions of Prometheus supported Protobuf-based binary protocol, but currently every exporter should reply in a human-readable text-based format. Here is a partial example of the output of node_exporter that exposes metrics about the machine it is running on:
# HELP node_network_receive_bytes_total Network device statistic receive_bytes.
# TYPE node_network_receive_bytes_total counter
node_network_receive_bytes_total{device="awdl0"} 41984
node_network_receive_bytes_total{device="bridge0"} 0
node_network_receive_bytes_total{device="en0"} 1.6107387904e+10
node_network_receive_bytes_total{device="en1"} 0
The full specification of the Prometheus export format can be found in the Prometheus documentation for exposition formats.
It is a human-readable format and the fact that metrics are exposed on a simple HTTP GET endpoint makes it very easy to manually check a snapshot of the current metric values.
Instrumentation of your application
While existing exporters are very useful, custom metrics can often tell much more about the health and performance of the application. It is good to think of instrumentation of your code in the same way we think about logging.
Most modern languages and frameworks already have instrumentation support. For Java, I would recommend using the Micrometer library that allows us to expose metrics in an abstract way without locking in on one particular monitoring system. The latest version of Spring Boot uses Micrometer as an instrumentation library by default. For other platforms you can check the official list of instrumentation libraries Prometheus documentation for client libraries.
Monitoring of a locally running application
Sometimes it is useful to take a look at the metrics of an application running in your local environment. You might want to test your application’s metrics exporter itself or you are working on some functionality that is easily observable through exposed metrics.
As discussed above the Prometheus server manages the list of the exporter endpoints to be scraped. The interval at which scraping happens is also defined in the Prometheus server configuration. It is typically not possible to use the central Prometheus server to scrape metrics from your local machine.
There are several ways to collect and visualize metrics from a locally running application:
Run a Prometheus server and Grafana locally, set them up to scrape metrics from your application, and make a dashboard in Grafana to visualize it. This way requires significant effort to start scraping metrics and can be too overwhelming for such a purpose.
Manually access the exporter endpoint in a browser and check the metrics snapshot. In most cases, it is enough to see the immediate value of a metric, but it might not be enough if you care about metric value changes over time. Especially for gauge type metrics, it is usually necessary to see a series of metric values.
Use tools that will collect metrics from specified endpoints and visualize them. That is where the Metricat application can be helpful.
Meet Metricat
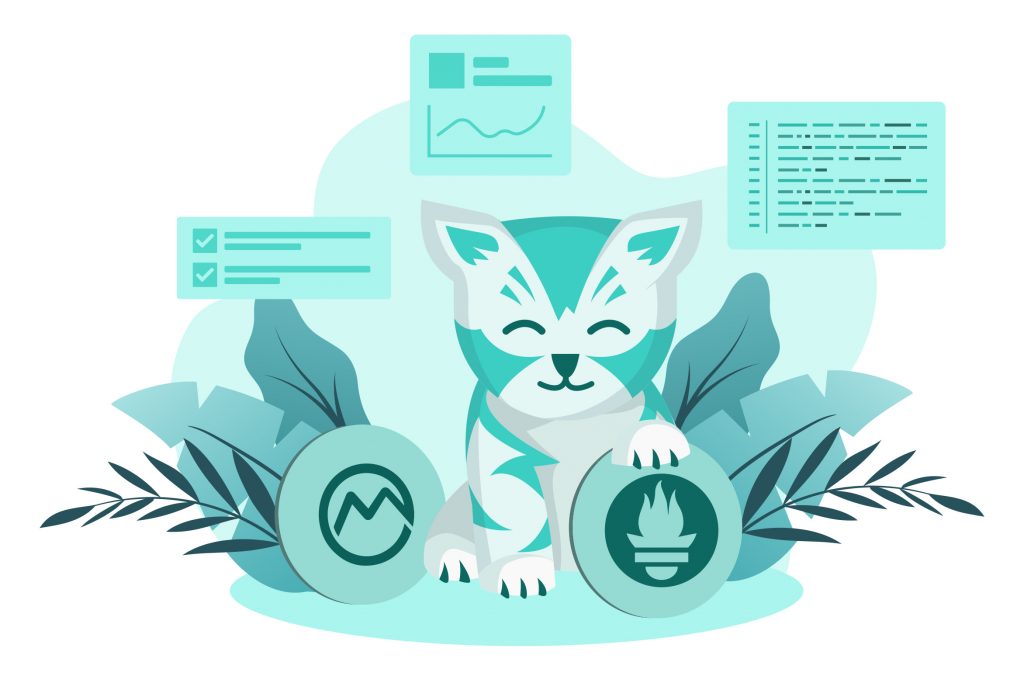
Metricat is a macOS application for recording and visualizing metrics from a specified endpoint. It can be used to record metrics not only from local but also from remote exporters.
There are several scenarios where Metricat might be handy for a developer.
Local development and debugging
Since Metricat is running locally, you can freely record metrics from any locally running application. This can help with the development and testing of monitorable applications.
Recording metrics with high resolution
The scraping interval can be set freely in Metricat, even once per second. This opens the possibility for recording high-resolution metrics from the server even in production. It's not common to have such a high-resolution scraping interval in production systems, so this feature might help to catch metric changes that are invisible in production Grafana.

Export scraped metrics
After scraping metrics with Metricat, selected metrics can be exported to a CSV file to be used in any other visualization or data analysis tool for further investigation.

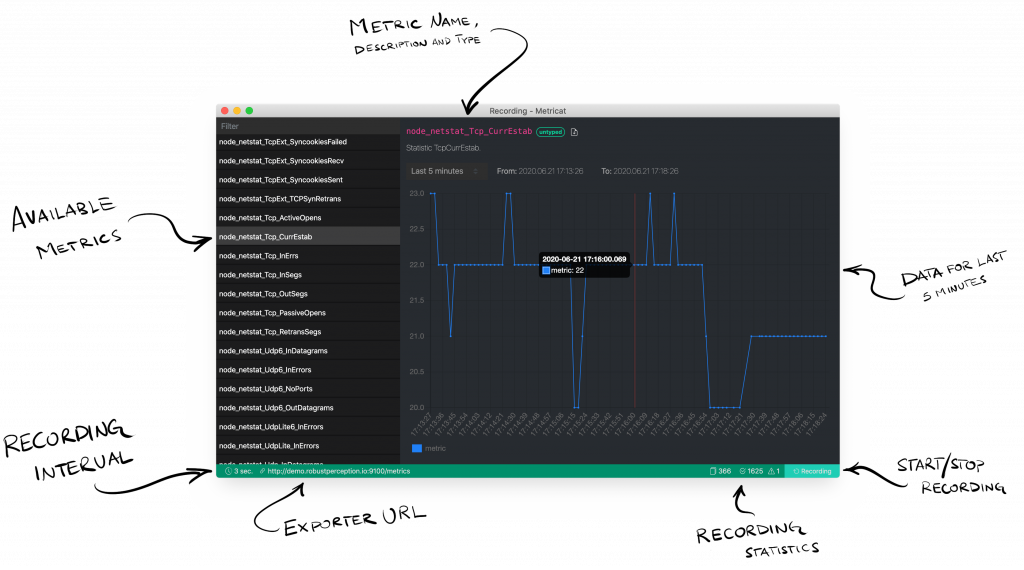
Metricat UI
After installing and running the app you will see the connection screen. You can enter your exporter URL and desired interval between scrapings.

After recording starts you will see the list of recordings from which you can choose the one you are interested in and begin monitoring.
Summary
Making server application monitorable is a part of hygiene in the software development world nowadays. We looked at Prometheus, one of the most popular monitoring systems. Discussed how to test metrics exporter of your application locally and use it for debugging of your application.
You can download Metricat and give it a try. It is still in development, more features are planned to be added in the near future, like recent exporters list and query language support.