
This November, accompanied by 3 other members of the Shop team, I attended Devoxx Belgium 2019, held in Antwerp, Belgium - the birthplace of Devoxx and most populous city of Belgium.

Devoxx is a developer community conference series started in 2001 which quickly grew to become one of the largest vendor-independent Java conferences in the world. Today, Devoxx conferences are also held in France, Poland, Ukraine, Morocco, and the UK.
Devoxx Belgium took place in "Kinepolis," one of the largest cinemas in Europe. The speakers' video and slides were projected on the huge cinema screens in 4K using the available THX audio setup. The view was great!


In this blog post, I'd like to present a small hands-on example on monitoring a Spring Boot application in Kubernetes using what I learned at Devoxx. In particular, I'd like to talk about:
- Preparing a Spring Boot application
- Installing Docker and Kubernetes
- Building a Docker image
- Deploying to Kubernetes
- Monitoring our application inside Kubernetes
Monitoring Example - Spring Boot application in Kubernetes
1. Preparing a Spring Boot application
For this example, I'm going to use a sample "Hello World" Spring Boot application that uses Armeria. On the Shop team we use Armeria to develop high-performance asynchronous microservices that use HTTP/2 as a session layer protocol. I want to use Armeria in this example to show how you can expose a custom metrics endpoint and have Prometheus pull metrics from it. Examples on how to get started with Armeria are available on Armeria's GitHub repo. The source code for this example is on GitHub. I've only tested the code on macOS.
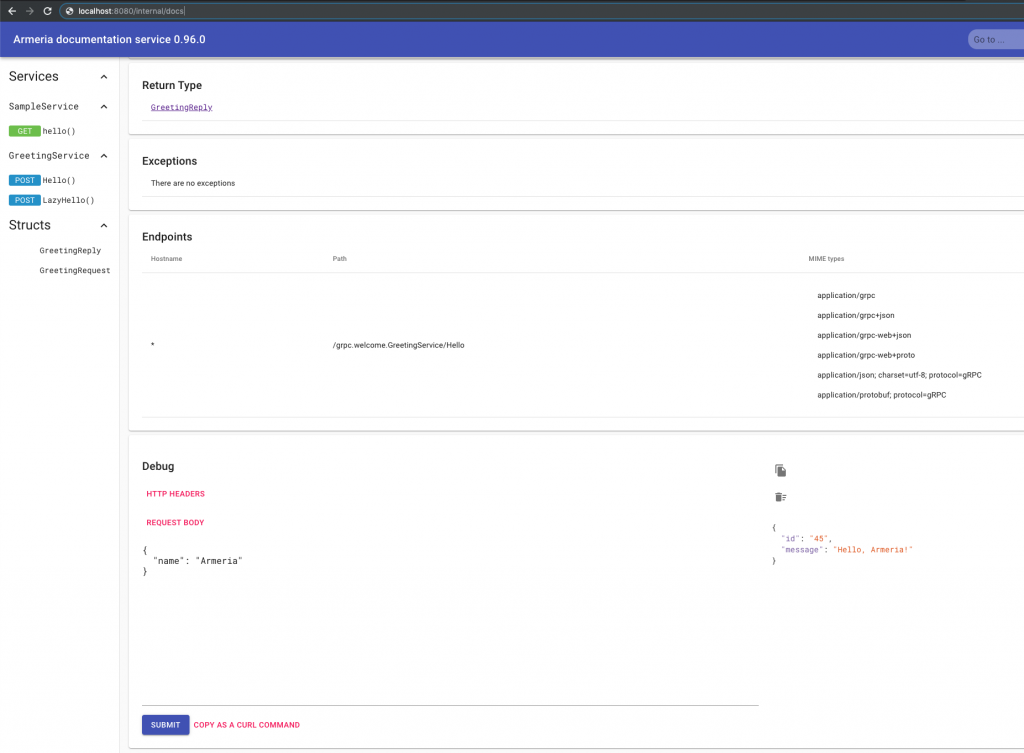
I have set up a gRPC Service and an HTTP Service which we can call by navigating to /internal/docs. DocService is a single-page web application that comes out of the box with Armeria listing all of our services and allowing us to call test them. More about it can be found on Armeria's official documentation.
2. Installing Docker & Kubernetes
Docker
Before we get started with Kubernetes, we need to install Docker. If you are just getting started with Docker, I found the official quickstart guide useful. We're going to use a public registry to push our application image to, so please register and login to Docker through the GUI or by running:
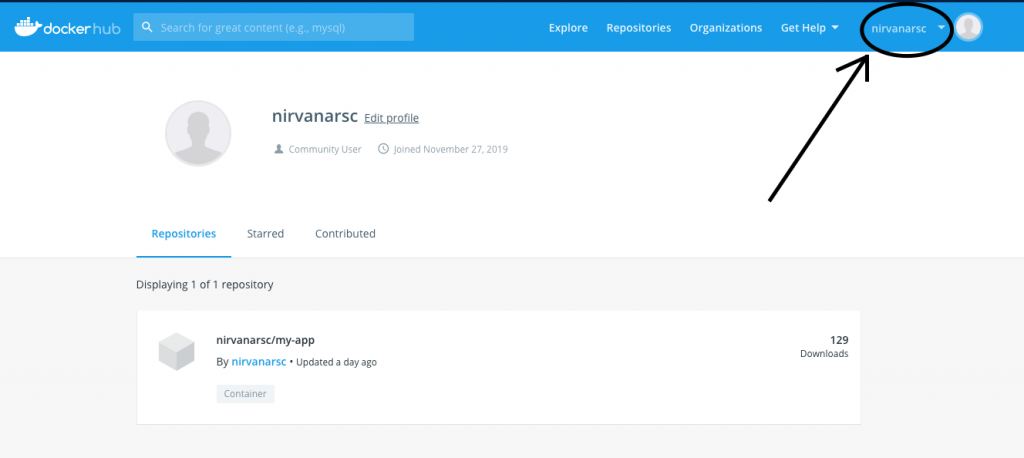
$ docker loginThere seems to be some confusion online regarding the user name you should use when prompted to login. Do not use your email! Use the Docker ID you chose when signing up. You can find your Docker ID in the upper right corner after logging in to Docker Hub.
Kubernetes
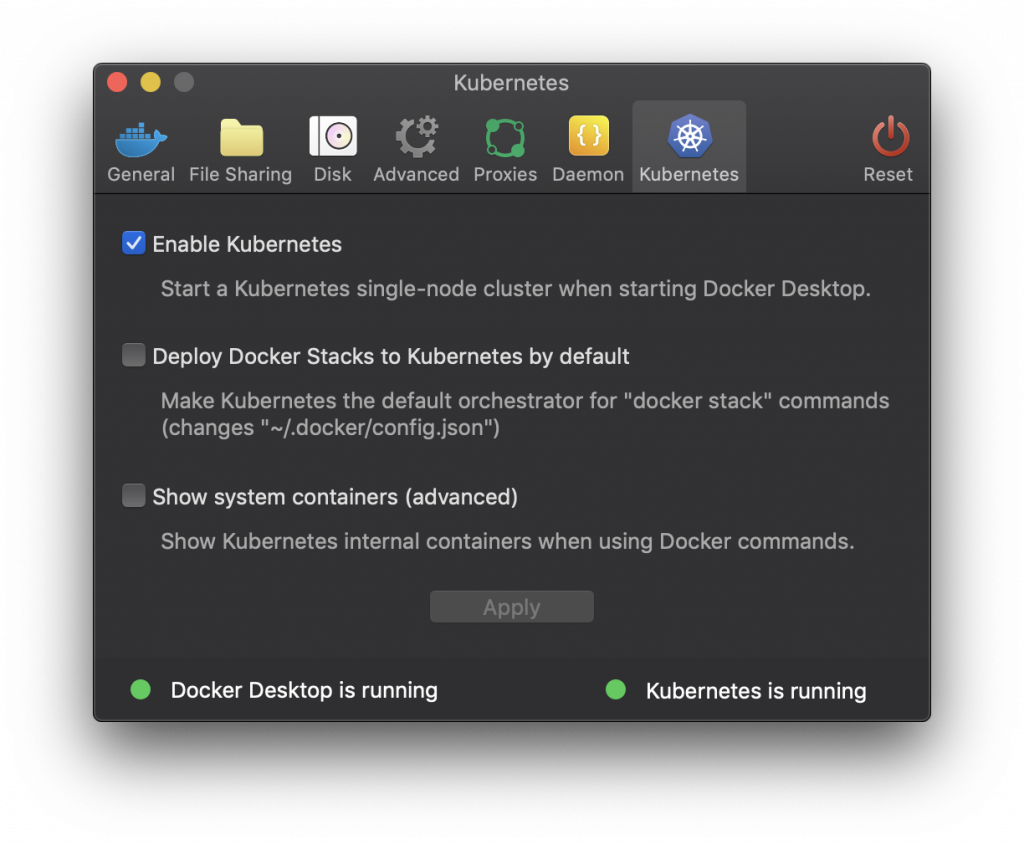
Okay now let's install Kubernetes. For this example, we're just going to enable Kubernetes inside Docker.
Alternatives to docker-desktop for running a local Kubernetes cluster include:
3. Building an Image
If you've got this far you should be able to run:
$ kubectl cluster-infoand see something similar to the following:
Kubernetes master is running at https://kubernetes.docker.internal:6443
KubeDNS is running at https://kubernetes.docker.internal:6443/api/v1/namespaces/kube-system/services/kube-dns:dns/proxy

To further debug and diagnose cluster problems, use 'kubectl cluster-info dump'.
So far so good. Now let's build a docker image for our Spring Boot app. All we need to do is write a Docker file and run a Docker daemon, while watching out for the best-practices for Docker. Perhaps following the first part of this guide.
Jib
Or we can just jib it. Jib is a tool developed by Google that helps you build Docker images for your Java applications without a Docker daemon - and without deep mastery of Docker best-practices. All we need to do is to add the following to our build.gradle file.
plugins {
    ..
    id 'com.google.cloud.tools.jib' version '1.8.0'
}

jib.to.image = 'docker_id/image_name'
In this example we're using a public docker registry but jib can be configured to upload images to a private registry. More on that in Jib's official documentation.
After we have configured the jib plugin, building our Docker image is as simple as running:
$ ./gradlew jibIf all is well after logging in to Docker Hub you should see your image on top.
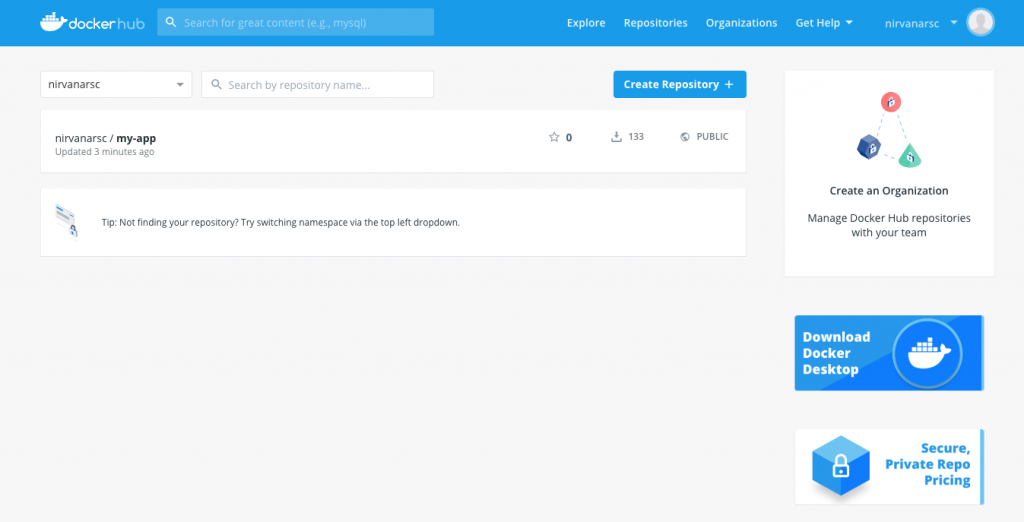
The url for your image should be of the form docker.io/docker_id/image_name
4. Deploying to Kubernetes
Next, let's deploy our image to Kubernetes. To do this, we need to write YAML configuration files, and as you can see in these tutorials from IBM and Mirantis, writing even a basic .yaml file correctly can be a daunting task. However, there is a very easy way to get started, which I found out at Ray Tsang's session "Best Practices to Spring to Kubernetes Easier and Faster" at Devoxx. Instead of doing something like this:
$ kubectl create deployment my-app --image docker.io/nirvanarsc/my-appWe should add the --dry-run option like this:
$ kubectl create deployment my-app --image docker.io/nirvanarsc/my-app --dry-run -oyamlWhich will print the YAML configuration necessary for a Deployment with the specified image as follows.
apiVersion: apps/v1
kind: Deployment
metadata:
  creationTimestamp: null
  labels:
    app: my-app
  name: my-app
spec:
  replicas: 1
  selector:
    matchLabels:
      app: my-app
  strategy: {}
  template:
    metadata:
      creationTimestamp: null
      labels:
        app: my-app
    spec:
      containers:
      - image: docker.io/nirvanarsc/my-app
        name: my-app
        resources: {}
status: {}
The only thing I will modify here is to increase the replicas from 1 to 3. (Set the number of instances of our app to 3)
In the exact same way, we can get an initial configuration for our service. Running the following for example,
$ kubectl create service clusterip my-app --tcp=8080:8080 --dry-run -oyamlprints this:
apiVersion: v1
kind: Service
metadata:
  creationTimestamp: null
  labels:
    app: my-app
  name: my-app
spec:
  ports:
  - name: 8080-8080
    port: 8080
    protocol: TCP
    targetPort: 8080
  selector:
    app: my-app
  type: ClusterIP
status:
  loadBalancer: {}
Let's save both of these configuration to their own files. Create a folder named "k8s" and execute:
$ kubectl create deployment my-app --image docker.io/nirvanarsc/my-app --dry-run -oyaml > k8s/deployment.yaml
$ kubectl create service clusterip my-app --tcp=8080:8080 --dry-run -oyaml > k8s/service.yaml
Now deploying our app is as simple as running:
$ kubectl apply -f k8sTo access our application we will need to allow external traffic into our Kubernetes cluster.
This article will not be addressing Ingress/LoadBalancer/NodePort. Perhaps this article on Medium is a good overview on that subject.
Instead, we will just forward a local port to a port on the cluster like this:
$ kubectl port-forward svc/my-app 8080:8080Now we can access our internal/docs endpoint and our internal/metrics endpoint at http://localhost:8080.

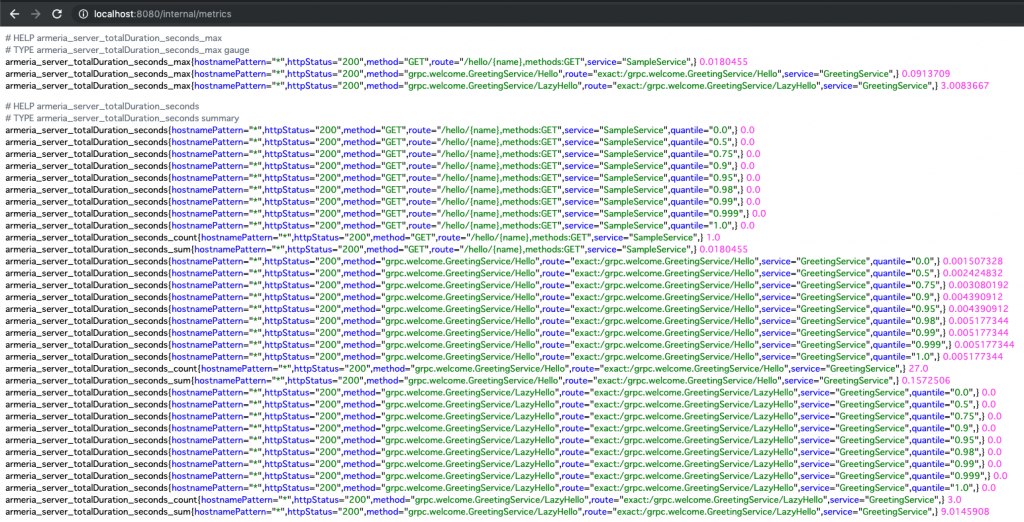
5. Monitoring our application inside Kubernetes
Finally, we can talk about monitoring. First a few words about Prometheus and Grafana.
Prometheus is a monitoring and alerting system. It was originally built by SoundCloud in 2012, but has since been open sourced and now is part of the CNCF. It is inspired by Google's BorgMon - one of Google's internal monitoring technologies used to monitor services running on Borg. Borg is Google's internal cluster scheduler, which in turn inspired Kubernetes. So Prometheus and Kubernetes have both been inspired by complementary technologies inside Google.
Grafana is an open source analytics and monitoring system. Prometheus and Grafana have become basically the de facto monitoring solution. Grafana should not be confused with Kibana, which runs on top of Elasticsearch and is used to analyze log messages. On the Shop team we also use Prometheus with Grafana as our monitoring solution.
It is possible to have an external instance of Prometheus discover and pull metrics from our Application inside Kubernetes, but for this example I'm going to install an instance of Prometheus and Grafana inside the cluster and have Prometheus discover our Application and scrape metrics from it.
To install Prometheus and Grafana in our cluster we're going to use Helm. Helm is a package manager for Kubernetes. Think of it like npm/apt for Kubernetes. Check out the official documentation on getting started if you have the time, but for this example, all the configuration we're going to need is:
$ brew install helm$ helm repo add stable https://kubernetes-charts.storage.googleapis.com/Installing Prometheus
We can install Prometheus in our cluster by running:
$ helm install my-prometheus stable/prometheusWhich should output something like:
NAME: my-prometheus
LAST DEPLOYED: Thu Dec  5 15:29:58 2019
NAMESPACE: default
STATUS: deployed
REVISION: 1
TEST SUITE: None
NOTES:
The Prometheus server can be accessed via port 80 on the following DNS name from within your cluster:
my-prometheus-server.default.svc.cluster.local

Get the Prometheus server URL by running these commands in the same shell:
  export POD_NAME=$(kubectl get pods --namespace default -l "app=prometheus,component=server" -o jsonpath="{.items[0].metadata.name}")
  kubectl --namespace default port-forward $POD_NAME 9090

The Prometheus alertmanager can be accessed via port 80 on the following DNS name from within your cluster:
my-prometheus-alertmanager.default.svc.cluster.local

Get the Alertmanager URL by running these commands in the same shell:
  export POD_NAME=$(kubectl get pods --namespace default -l "app=prometheus,component=alertmanager" -o jsonpath="{.items[0].metadata.name}")
  kubectl --namespace default port-forward $POD_NAME 9093

The Prometheus PushGateway can be accessed via port 9091 on the following DNS name from within your cluster:
my-prometheus-pushgateway.default.svc.cluster.local

Get the PushGateway URL by running these commands in the same shell:
  export POD_NAME=$(kubectl get pods --namespace default -l "app=prometheus,component=pushgateway" -o jsonpath="{.items[0].metadata.name}")
  kubectl --namespace default port-forward $POD_NAME 9091

For more information on running Prometheus, visit:
https://prometheus.io/
Now if we also run:
$ export POD_NAME=$(kubectl get pods --namespace default -l "app=prometheus,component=server" -o jsonpath="{.items[0].metadata.name}")
  kubectl --namespace default port-forward $POD_NAME 9090
We should be able to access the Prometheus server at localhost:9090
But if we navigate to status/targets, we will see that Prometheus fails to discover our application.

There's two ways to fix this. First we can use an additional argument when installing the Prometheus chart through Helm -
We can create a file extraScrapeConfigs.yaml with the following settings
extraScrapeConfigs: |
  - job_name: 'armeria-metrics'
    scrape_interval: 1s
    metrics_path: /internal/metrics
    kubernetes_sd_configs:
      - role: endpoints
And then we need to update our Prometheus chart config by running:
$ helm upgrade --install my-prometheus --set-file extraScrapeConfigs=prometheus/extraScrapeConfigs.yaml stable/prometheusHowever I suggest we modify our deployment.yaml file by adding the following config allowing Prometheus to pull metrics from our app:
spec.template.metadata.annotations:
  prometheus.io/scrape: "true"
  prometheus.io/port: "8080"
  prometheus.io/path: /internal/metrics
So our deployment.yaml file should look like this:
apiVersion: apps/v1
kind: Deployment
metadata:
  creationTimestamp: null
  labels:
    app: my-app
  name: my-app
spec:
  replicas: 3
  selector:
    matchLabels:
      app: my-app
  strategy: {}
  template:
    metadata:
      creationTimestamp: null
      labels:
        app: my-app
      annotations:                               ### here
        prometheus.io/scrape: "true"
        prometheus.io/port: "8080"
        prometheus.io/path: /internal/metrics
    spec:
      containers:
      - image: docker.io/nirvanarsc/my-app
        name: my-app
        resources: {}
status: {}
And we need to re-deploy our app with the updated configuration:
$ kubectl delete deploy/my-app svc/my-app
$ kubectl apply -f k8s
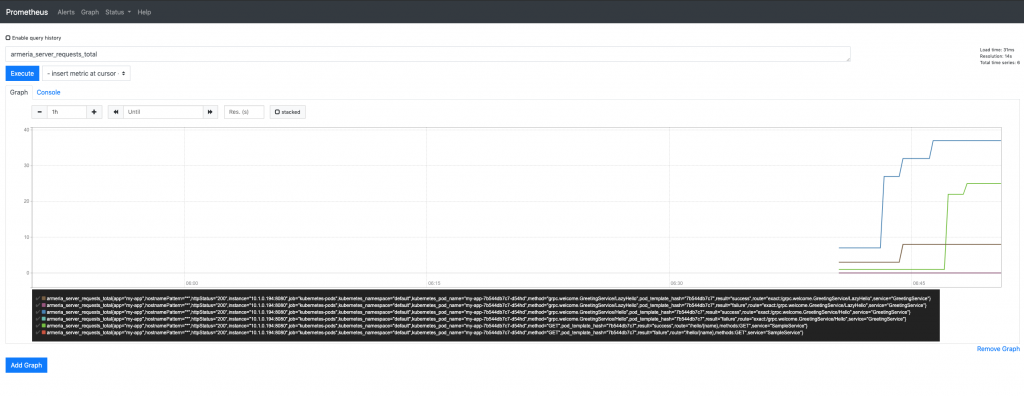
$ kubectl port-forward svc/my-app 8080:8080If we navigate to status/targets now, we should see the 3 pods of our application. We should also be able to query our metrics.

Installing Grafana
Lastly, we can install Grafana and visualize our metrics.
$ helm install my-grafana stable/grafanaNAME: my-grafana
LAST DEPLOYED: Thu Dec 5 16:03:33 2019
NAMESPACE: default
STATUS: deployed
REVISION: 1
NOTES:
1. Get your 'admin' user password by running:
kubectl get secret --namespace default my-grafana -o jsonpath="{.data.admin-password}" | base64 --decode ; echo
2. The Grafana server can be accessed via port 80 on the following DNS name from within your cluster:
my-grafana.default.svc.cluster.local
Get the Grafana URL to visit by running these commands in the same shell:
export POD_NAME=$(kubectl get pods --namespace default -l "app=grafana,release=my-grafana" -o jsonpath="{.items[0].metadata.name}")
kubectl --namespace default port-forward $POD_NAME 3000
3. Login with the password from step 1 and the username: adminFollowing the instructions above we should be able to log in to Grafana at localhost:3000. Then we can add Prometheus as a data source and create a dashboard with our applications metrics.
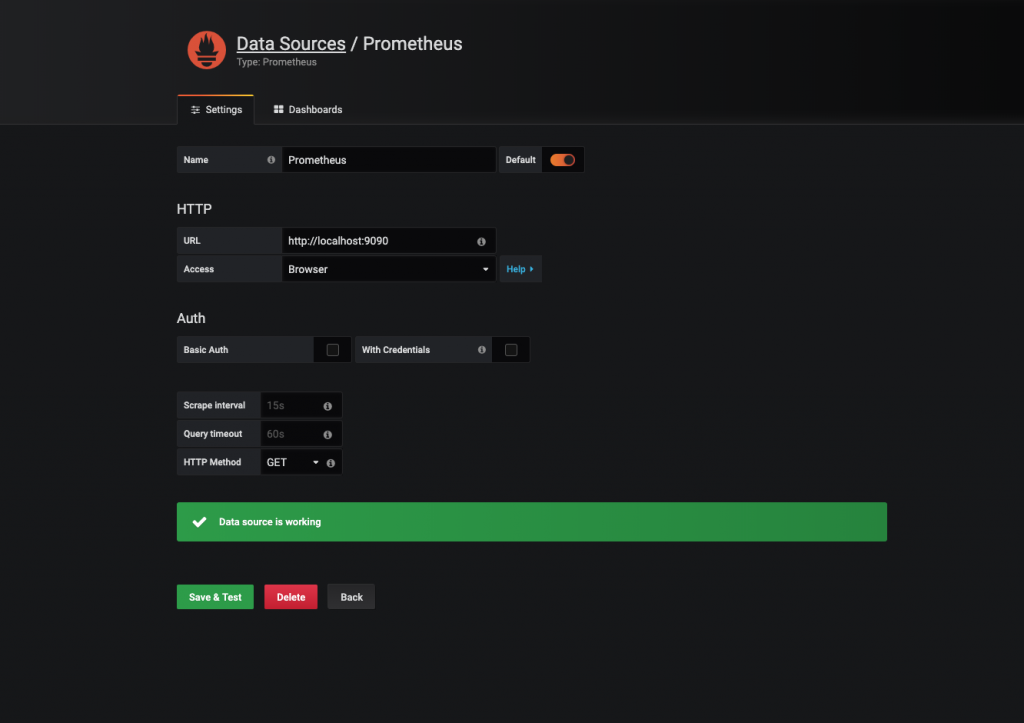
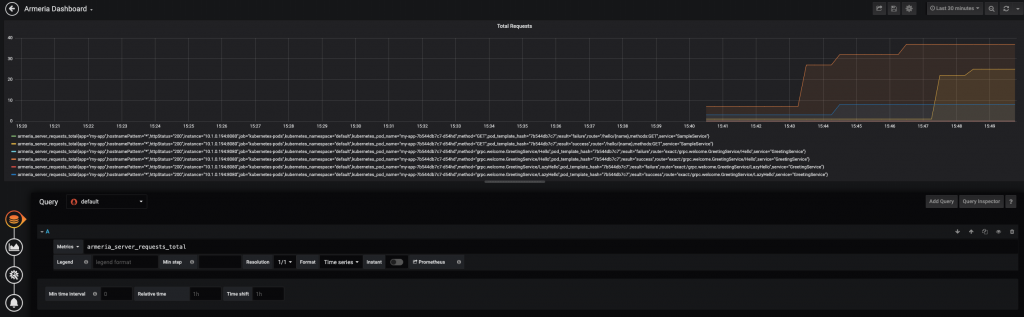
And that's it! We have successfully used Prometheus and Grafana to build a dashboard visualizing our app's metrics.
Conclusion
Getting started with Kubernetes can be quite challenging. I think there are 3 main reasons for that:
- Writing a good YAML file is difficult
- Knowledge of networking is required
- There are a lot of small interconnected components such as Docker, Pods, Services, and ReplicaSets
I hope this blog post will make it a little easier for you to begin development on Kubernetes.
Happy coding!
A list of the Devoxx sessions about Kubernetes I found most useful: