
My name is Yoichiro, and I work in the Technology Strategy Department here at LINE. Thanks for taking the time to check out our blog. Today we’ll be introducing the system we use for the error detection and notification process for the gradually growing service “LINE BusinessConnect.”
About LINE Business Connect
See this blog for more information on LINE Business Connect.
Why Don’t Messages Get Delivered?
LINE Business Connect was introduced this year on February 26 during the LINE Showcase 2014 February event. In the almost half a year that has passed since the feature was first introduced, we have had several forerunners of the future to register for the service. We are very pleased to be able to offer LINE users the chance to experience new and innovative ways of using services offered by partner companies. All of us here have had many moments where we were surprised by the interesting ways people have come up with for using LINE, bringing us face to face with the fact that LINE has outgrown the confines of a simple messaging service. We hope you continue to take advantage of all the exemplary services LINE Business Connect has to offer.
The thing that really makes LINE BusinessConnect unique is that the development process doesn’t start and end with LINE Corporation. LINE BusinessConnect functions as a “pipeline” to the LINE Platform. Businesses use their own servers to process messages from LINE users sent through this pipeline to the services they provide using LINE Business Connect. Messages and stickers posted by users literally flow right through the LINE Platform Platform and into the target servers run by the businesses themselves. They can then analyze the content of messages and the types of stickers received in order to send appropriate responses to the users from their servers.
The first step to getting a system ready to use LINE Business Connect is to register with the LINE Platform and configure the technical settings necessary to deliver information from the LINE Platform to the business’s server. In other words, the server will be registered as the endpoint URL in the LINE Platform. Once this is done, all the different kinds of messages and notifications, such as those sent when a user adds your account as a friend, will be sent from the LINE Platform. If all goes well, the LINE Platform connects to the registered endpoint URL and an endless stream of JSON strings flow like wine into the partner company’s servers.
IF all goes well, that is.
Unfortunately, the process doesn’t always go as smoothly as we would like. I think we’ve all experienced situations where things didn’t go according to plan even though all the right settings were in place. For LINE Business Connect, an issue has surfaced where data that was supposed to be sent from the LINE Platform doesn’t ever arrive. “We set the endpoint URL correctly, the server program used to receive the requests is running, and we opened a hole in the firewall like we were supposed to, but the messages never arrive...”, “Why!”, and “What on earth is wrong with this thing!?” have become all too familiar phrases for the engineers working on these projects.
Confirming the communication channel by receiving the initial request is most certainly the first step to using LINE Business Connect. However, if the messages never come, the engineers on the other end are left scratching their heads with no idea as to what the root of the problem is. In the next section, we’ll be taking a detailed look at what exactly is going on.
Visualizing the LINE Platform Side
After a user sends a message or posts some other form of information, the message received by the LINE Platform is then sent to the target endpoint URL. In other words, the connection between LINE Platform and the company’s server is made from the LINE side.
If the company’s server is not receiving the first message sent from the LINE Platform, then one of the following problems may be to blame.
- The registered endpoint URL is incorrect.
- The SSL certificate required for sending data with HTTPS is a suspicious-looking self-signed certificate.
- The partner company never opened a hole in its firewall.
- There was an issue with the program used by the company.
- The endpoint URL was changed by that change was never applied on the LINE Platform Pplatform side.
- The domain written in the registered endpoint URL is not a registered DNS domain name.
- The test account is being used as the live account by mistake.
There is a limit to what the businesses adopting LINE Business Connect can do to investigate exactly which one of the issues listed above is the root of the problem. If the LINE Platform fails to connect to the company’s server in the first place, then nothing will be left on the servers to examine afterwards. In such cases, an investigation must be performed on the LINE Platform end. This also means that only LINE employees will be able to look into the problem. It’s pretty painfully obvious that all the back and forth communication required to solve the problem will take time and slow down the solution process.
Incorrectly distributed messages are not the only problem we have to face. The following issues have also surfaced.
- An unpredicted error occurs on the company’s server, and any response other than 200 is rejected and sent back to the LINE Platform.
- The load on the company’s server increases, causing responses to take 10 seconds or more to be sent back to the LINE PpPlatform.
These are both entirely possible scenarios. It is also entirely possible in these situations for the company’s engineers to figure out what the problem is by performing a careful investigation of the server logs on their end. However, from a monitoring perspective, the two scenarios outlined above must be detected in real-time even on the LINE Platform side..
At the end of the day, problems would be solved much faster and companies using LINE Business Connect would be able to provide a more precise level of service if the engineers on the company’s end were able to visualize the error detection situation on the LINE Platform end.
Architecting Collection Servers
Channel Gateway is the part of the LINE Platform responsible for dealing with LINE GAME apps and a host of other family applications integrated with LINE. It also handles all the communication between LINE Business Connect and the company’s servers. When messages are sent from LINE to the company using BusinessConnect, they are processed through Channel Gateway.
In order to detect the errors occurring in the situations listed above, all you really need to do is set up error detection logic on the appropriate steps in the process run by Channel Gateway. To explain what that looks like in very real terms, first the connection between Channel Gateway and the registered endpoint URL must be confirmed, then the information is sent, and lastly the result is received from the company’s servers. Then this string of processes is checked for transmission exceptions, the HTTP status codes returned from the other server are checked as well, and the entire process is timed to see if it takes longer than 10 seconds.
It’s also a good idea to take error information detected by Channel Gateway and collect it in some form. In most cases, errors will continue to occur until the cause of the problem is fixed. When the information about the errors occurring on the company’s side are finally reported, it would be much more preferable if errors were bundled into groups that showed the number of times each error occurs per minute, rather than just reporting all the events that occurred. Channel Gateway runs multiple units at the same time, so it would be great if a separate collection server were set up to handle the aggregation process, instead of simply relying on each Channel Gateway to do the job for them.
For this collection server, a certain degree of real-time information processing is necessary for the case under discussion. We’re talking about a system that can put out report after report for each time unit we need. These requirements can be met using the following architecture.
- Export the error information into a file, then analyze and aggregate that data for each time unit.
- Temporarily store error information using memcached or another similar method, then collect that information from memchached and aggregate it for each time unit. * Use the Apache Storm framework to define and run the aggregation process.
- Find a product that will run real-time aggregations and let it handle the collection process.
For groups of servers with high access volumes, Apache Storm might be the best solution if you plan on calculating the number of all requests made in addition to running real-time analysis. However, in our current discussion we are talking about only collecting data when errors are detected, meaning that collectable target data really is generated that frequently.
We decided to find a product that runs aggregations in real-time and let it handle the collection process. In other words, instead of coding an enormous, elegantly scalable system by hand, we put a priority on finding a product that allowed us to go from the preparatory stages to implementation in the shortest amount of time, in order to allow us to get a collection system up and running using as few work-hours as possible. Also, the less we have to code ourselves, the better the quality of the output will be. Careful consideration should be given to the product’s performance record when selecting which product to use.
Collecting Error Information Using Fluentd and Norikra
In the end, we decided to adopt the following two products.
- Fluentd - An open source data collector to unify log management.
- Norikra - An open source server software provides "Stream Processing" with SQL, written in JRuby, runs on JVM.
Fluentd is so prevalent in the world of log management today that it wouldn’t be too much of a stretch to say that where there are logs, there is Fluentd. The product uses a variety of in and out plugins that allow the user to extract and output data of value from an endless sea of log data. Error information detected by Channel Gateway is thrown to Fluentd first.
Next, the actual collection processing itself is done using Norikra. According to the FAQs, the product is pronounced “No-rick-la.” We refer to it affectionately as “Norika-san.” Norikra is available as an in and out plugin for Fluentd. The data flowing in a constant tidal wave into Fluentd is directed to Norikra, where it is aggregated according to time units following pre-set “definitions set for SQL LIKE data collections.” The results are then returned to Fluentd. The entire precise can be set up and executed pretty easily. Esper is used inside of Norikra, which was incidentally created by a LINE employee. The product is already used internally in several places here at LINE and has a solid track record, leading to our decision to adopt it.
The structure of the error detection system currently employed by LINE BusinessConnect is shown in the following diagram.
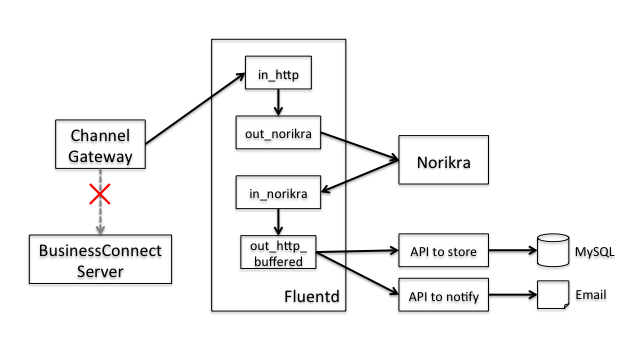
As mentioned earlier, errors targeted for collection do not occur very frequently. So we created two separate Fluentd and Norikra packages and added one into the “active server” and the other into the “standby server.” The server in operation is consistently monitored to make sure it is running. If it fails to respond, the system is designed to switch over to the standby server.
Aggregation Processing Performed by Norikra
The error information targeted for collection consists of the following items.
- Channel ID: The ID issued to the client and handled by Channel Gateway
- Reason: The cause of the problem. (Unable to connect, error status code returned, etc.)
- Detail: Detailed information about the error. (Reasons why the system couldn’t connect, specific values of returned error status codes, etc.)
- Timestamp: The date and time the error was detected.
This information is passed from Channel Gateway to Fluentd, where it then flows lock, stock, and barrel into Norikra. Norikra then uses pre-set collection definitions to aggregate the data. We registered the following two collection definitions for LINE BusinessCollect.
- Collect conditions in which errors occur every minute – Post this data to LINE Developers, a website created by LINE designed especially for programmers.
- Collect conditions in which errors occur every 5 minutes – The developer in charge is notified via email if an error is detected even once within a five minute interval.
Norikra uses a syntax similar to SQL called “EPL” (Esper Processing Language) to define aggregation processing. It causes the info put into Norikra to simulate a “two-dimensional table,” using aggregation functions like those found in SQL to define aggregation processes. The fact that the “time” element was adopted as a requirement for deciding the population of collection targets really makes this product stand out. These time units are referred to as “windows.” If you refer to the flow of information as a stream, the product allows the user to decide collection units based on definitions such as “divide the stream into separate divisions every 60 minutes.”
The EPL used in the actual program is shown below.
SELECT
current_timestamp() AS collected_timestamp, // Collection time
channelId AS channel_id,
reason,
detail,
count(<em>) AS error_count, // Number of errors generated
min(timestamp) AS first_timestamp, // Time that the first error in the current time interval was detected
max(timestamp) AS last_timestamp // Time that the last error in the current time interval was detected
FROM
event_endpoint_error_log.win:time_batch(60 sec) // Defines each window as 1 minute long
GROUP BY
channelId, reason, detail
HAVING
count(</em>) > 0 // Limited only to errors that occur more than once.
Many of you are most likely very familiar with a similar SQL code excerpt. The portion of the code shown above that differs from SQL appears in the “FROM” section. After setting something that looks a lot like a table name, “.win:time_batch(60 sec)” appears out of nowhere. This is the definition for the window. In addition to “time_batch”, “length_batch” and other attributes used to set the size of the window definition are found here as well.
The code above is for a collection that occurs at 1 minute intervals, which means that it defines a collection process that will be posted to the LINE Developers site. Apart from that, another definition with the exact same content and a window defined as “.win:time_batch(300 sec)” was also registered. This definition collects data at 5 minute intervals used to send email notifications directly to the developer.
Forwarding and Using Collection Results
Collection results are forwarded by calling an internal API via HTTP. The endpoint set for the API changes depending on how the collection results will be used. In order to see exactly how this works, let’s take a look at the fluent.conf file listed below.
<!—- Used for Posting to LINE Developers -->
<match norikra.query.error_info>
  type http_buffered
  flush_interval 2s
  endpoint_url http://../api/bcErrorLog/store
  http_read_timeout 10
  http_open_timeout 3
</match>
<!—- Use for Email Notifications -->
<;match norikra.query.notify_info>
  type http_buffered
  flush_interval 2s
  endpoint_url http://../api/bcErrorLog/notify
  http_read_timeout 10
  http_open_timeout 3
</match>
Since collection results are output at 1 minute and 5 minute intervals, the frequency at which the above API is called is equivalent to the number of LINE BusinessConnect accounts with errors occurring at the same time. In other words, not that many. The process is pretty straightforward. Each error is stored in the MySQL database, and a message containing the details of the errors is sent to the email address of the developer registered on LINE Developers. The following is an example of an email the developer may receive.

In addition to this email, the following is also displayed on the LINE Developers website.

This part of the process was all made possible using very simple coding. We actually had to write very little code to create the entire system introduced in this blog.
Checking Up on Norikra
Norikra runs in the JRuby environment. In other words, since it runs on the JavaVM system, GC behavior is also something to be concerned about. In the use case we are discussing this time, the amount of collection targets when everything is running normally should be extremely few. This is also assuming that the partner company’s server is also running properly. However, if a path in the network gets cut off causing some kind of error to occur, it is quite possible for the situation to devolve into a nightmare where all communication attempts fail continuously. Even in a situation like this, we want the collection server to keep on doing its job. In order to achieve this goal, one must to some degree know in advance how far you can push the system. This is especially true of GC behavior, which requires monitoring.
First, we won’t give any options to Norikra. We’ll run it using the default settings and then try adding stress to it. In order to view the GC behavior, set the option designed for JavaVM and start up Norikra. (Actually you could easily set the “-gc-log” option, but we didn’t know that when we implemented the excerpt shown below.) Once that’s done, we tried continuously making around 3,000 requests a second, using the 1 minute interval for the collection definition, as shown above.
norikra start ... -Xloggc:norikra_gc.log -XX:+PrintGCDateStamps -XX:+PrintGCDetails
The results were pretty bleak. The system’s GC (Garbage Collection) was maxed out before even 2 minutes were up, a complete and utter failure. The log recorded during that test is given below. The output time and a few other parts have been removed.
...
[CMS-concurrent-mark-start]
[CMS-concurrent-mark: 0.336/0.336 secs] [Times: user=1.69 sys=0.00, real=0.34 secs]
[CMS-concurrent-preclean-start]
[CMS-concurrent-preclean: 0.690/0.690 secs] [Times: user=1.38 sys=0.01, real=0.69 secs]
[CMS-concurrent-abortable-preclean-start]
[CMS-concurrent-abortable-preclean: 0.000/0.000 secs] [Times: user=0.00 sys=0.00, real=0.00 secs]
[GC[YG occupancy: 185057 K (192000 K)]257.267: [Rescan (parallel) , 0.2725640 secs]257.539: [weak refs processing, 0.0000130 secs] [1 CMS-remark: 255999K(256000K)] 441057K(448000K), 0.2726680 secs] [Times: user=2.97 sys=0.01, real=0.27 secs]
[CMS-concurrent-sweep-start]
[Full GC 257.653: [CMS...: 257.937: [CMS-concurrent-sweep: 0.397/0.398 secs] [Times: user=0.51 sys=0.00, real=0.40 secs]
 (concurrent mode failure): 255999K->255999K(256000K), 2.5638670 secs] 447999K->367189K(448000K), [CMS Perm : 55094K->55094K(83968K)], 2.5639810 secs] [Times: user=2.55 sys=0.02, real=2.57 secs]
[GC [1 CMS-initial-mark: 255999K(256000K)] 438249K(448000K), 0.5103370 secs] [Times: user=0.51 sys=0.00, real=0.51 secs]
[CMS-concurrent-mark-start]
[Full GC 261.884: [CMS...: 262.145: [CMS-concurrent-mark: 0.416/0.417 secs] [Times: user=1.81 sys=0.01, real=0.42 secs]
 (concurrent mode failure): 255999K->255999K(256000K), 2.6813440 secs] 447999K->381849K(448000K), [CMS Perm : 55094K->55094K(83968K)], 2.6814830 secs] [Times: user=3.46 sys=0.00, real=2.69 secs]
[Full GC 265.579: [CMS: 255999K->255999K(256000K), 2.2155670 secs] 447999K->408257K(448000K), [CMS Perm : 55094K->55094K(83968K)], 2.2157040 secs] [Times: user=2.22 sys=0.00, real=2.22 secs]
[GC [1 CMS-initial-mark: 255999K(256000K)] 408257K(448000K), 0.2598430 secs] [Times: user=0.26 sys=0.00, real=0.26 secs]
[CMS-concurrent-mark-start]
[CMS-concurrent-mark: 0.390/0.390 secs] [Times: user=1.94 sys=0.01, real=0.39 secs]
[CMS-concurrent-preclean-start]
[Full GC 268.730: [CMS...: 269.144: [CMS-concurrent-preclean: 0.698/0.699 secs] [Times: user=0.98 sys=0.00, real=0.69 secs]
 (concurrent mode failure): 255999K->255999K(256000K), 2.5817600 secs] 447999K->423795K(448000K), [CMS Perm : 55094K->55094K(83968K)], 2.5818850 secs] [Times: user=2.56 sys=0.02, real=2.58 secs]
...以下Full GCが続く...
In the startup scripts for Norikra, we set the different parameter values for Java VM based on real-life experience cultivated with Norikra in the past. As a general rule, we don’t change these values unless absolutely necessary. However, there are parameter values that are not set at all, such as the “heap size.”
When we ran the test above, we started the test with the heap size at 500 MB. This meant that GC was handling a request flow volume larger than it was, filling up the GC in a lightning-fast storm of requests. This just goes to show you how important it is to test systems in advance.
We set the heap size to 3 GB (the physical memory of the server is 4 GB), and tried adding stress to it again.
norikra start ... -Xmx3g -Xms3g -Xmn2g -Xloggc:norikra_gc.log -XX:+PrintGCDateStamps -XX:+PrintGCDetails
We threw 3,000 requests a second at it for over an hour, but there were no problems whatsoever. We finally had a stable system to work with.
...
[GC 3860.433: [ParNew: 1533788K->377399K(1572864K), 0.2588920 secs] 1681160K->524771K(2621440K), 0.2590400 secs] [Times: user=2.61 sys=0.00, real=0.26 secs]
[GC 3877.872: [ParNew: 1425975K->524288K(1572864K), 0.2940130 secs] 1573347K->672210K(2621440K), 0.2941390 secs] [Times: user=3.17 sys=0.01, real=0.29 secs]
[GC 3894.437: [ParNew: 1572864K->380689K(1572864K), 0.1914270 secs] 1720786K->528611K(2621440K), 0.1915510 secs] [Times: user=2.07 sys=0.01, real=0.19 secs]
[GC 3914.932: [ParNew: 1429265K->395123K(1572864K), 0.2320380 secs] 1577187K->543045K(2621440K), 0.2321520 secs] [Times: user=2.45 sys=0.01, real=0.23 secs]
[GC 3935.819: [ParNew: 1443699K->480220K(1572864K), 0.2667290 secs] 1591621K->628143K(2621440K), 0.2668640 secs] [Times: user=2.88 sys=0.01, real=0.26 secs]
[GC 3950.107: [ParNew: 1528796K->349695K(1572864K), 0.1869800 secs] 1676719K->497618K(2621440K), 0.1871150 secs] [Times: user=2.00 sys=0.01, real=0.19 secs]
[GC 3970.718: [ParNew: 1398271K->370334K(1572864K), 0.2378780 secs] 1546194K->518257K(2621440K), 0.2380120 secs] [Times: user=2.48 sys=0.01, real=0.24 secs]
[GC 3992.460: [ParNew: 1418910K->524288K(1572864K), 0.2530590 secs] 1566833K->672301K(2621440K), 0.2531760 secs] [Times: user=2.79 sys=0.01, real=0.25 secs]
[GC 4004.683: [ParNew: 1572864K->362898K(1572864K), 0.1929120 secs] 1720877K->510912K(2621440K), 0.1930450 secs] [Times: user=2.10 sys=0.01, real=0.19 secs]
[GC 4026.351: [ParNew: 1411474K->371001K(1572864K), 0.2261900 secs] 1559488K->519025K(2621440K), 0.2263580 secs] [Times: user=2.33 sys=0.00, real=0.23 secs]
[GC 4046.745: [ParNew: 1419577K->473794K(1572864K), 0.2521100 secs] 1567601K->621969K(2621440K), 0.2522300 secs] [Times: user=2.63 sys=0.02, real=0.26 secs]
...
In order to test the number of simultaneous connections possible, we tried stress-testing the system by throwing over 5,000 requests a second all at once, but the system handled this with poise and grace, and without losing any collection targets. We wanted to test the system further by increasing the level of stress even more, but because there aren’t that many companies using LINE BusinessConnect and since messages are resent through Channel Gateway at 5 second intervals, we confirmed that even if all the communications failed at once in the current setup, we would still easily be able to operate the error detection system. In the end, we decided not to stress-test the system any further. However, if we have some free time in the future, we sure would like to try it.
Conclusion
In this blog entry, we gave a simple introduction to the system we use for error detection and notification for LINE BusinessConnect, which uses Fluentd and Norikra. It was very important for us to be able to create a system with everything we need and get it up and running as quickly as possible. We adopted products with a proven track record and put out the greatest possible results with as little effort as possible, a valuable life lesson we would like to take with us from here on out.
In the system outlined above, error detection is performed on the server that lies just before the Fluentd and Norikra package, but 100% the events are sent over to Fluentd and Norikra. It is more than possible to create the necessary error detection and statistical data using this system. For those of you reading this blog, you will probably need to solve the puzzle of where and how many Fluentd and Norikra packages to place in order to scale your system effectively. If you are working on a project with a scale larger than this one, it might be time for Apache Storm. It is now easier than ever to implement real-time collection processes, and we would like to encourage all of our readers to give it a try sometime soon!