
My name is Ryosuke Unno. I participated in the LINE internship program in the summer of 2021. As a university student, I study the application of reinforcement learning in video games. During this internship I joined Data Engineering Team 3 of the Data Platform Department. In this article, I'll introduce the activities I was engaged in during this internship period.
Background and issues
Currently, the Data Platform Department operates large-scale Hadoop clusters which offer over 300PB of disk capacity on more than 2000 data nodes. In these clusters, all activity logs (audit logs) in Hadoop clusters are recorded for audits. The recorded audit logs are converted to a table format by batch processing on a daily basis. This table is mostly used as means for cause analyses in the event of a problem in Hadoop clusters. However, the current daily batch processing causes a delay between the occurrence of a problem and analysis. Therefore, I wanted to analyze audit logs with lower latency and use the analysis result for investigating the cause in the event of a problem and alerting for the expected occurrence of a problem.
An actual audit log collected and stored in the filesystem of the clusters is text data with the following format:
2021-08-01 12:34:56,789 allowed=true ugi=hoge (auth:TOKEN) ip=/10.230.123.456 cmd=open src=/user/dir/somewhere dst=null perm=null proto=rpc |
In this internship, I was engaged in the development of a pipeline to convert audit logs in the text format to a format more suitable for analysis and use the structured data by visualizing it and detecting an abnormality. Audit logs are such large files that large-scale processing is required, but using an unstructured data format like the text format for analyses was considered to be difficult mostly due to the execution time of processing. This is why it was necessary to convert audit logs to a structured data format like Parquet suitable for query execution for analysis.
System configuration
The following figure shows the architecture of the entire system.
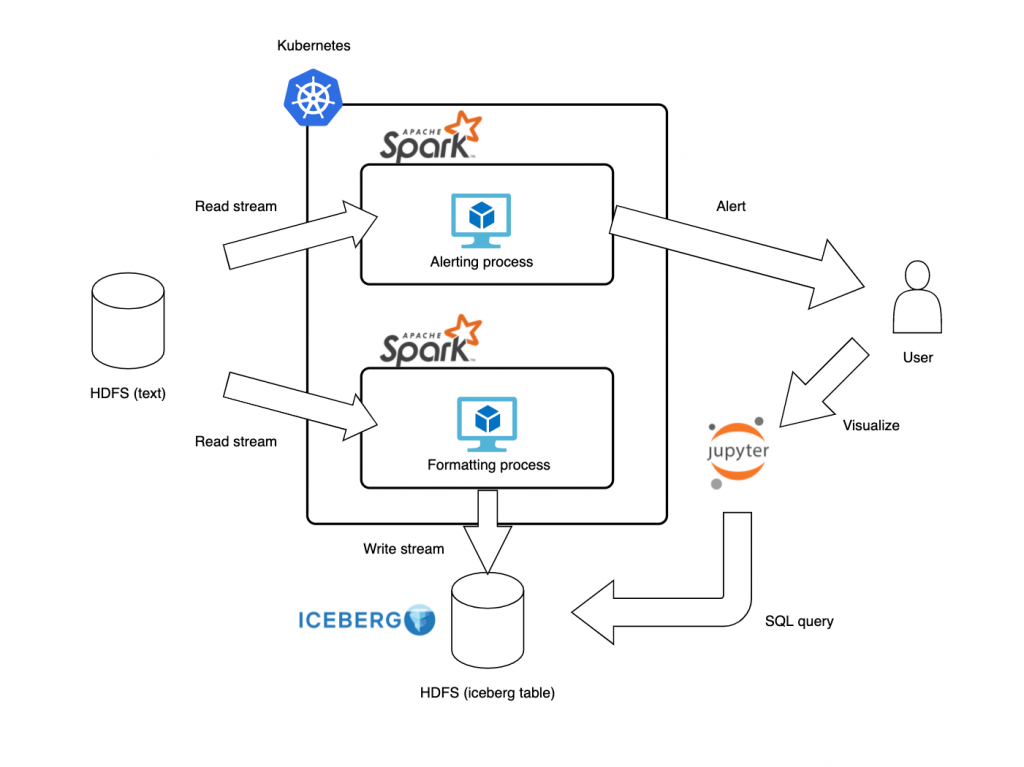
The constructed system consists of two pipelines.
One is the upper pipeline in the figure. It reads audit logs generated by clusters from HDFS and alerts the user if any behavior is judged to be noteworthy. The other is the lower one in the figure. It reads audit logs stored in HDFS as with the alerting pipeline, and converts and saves them to the table format. For one example of use cases of this system, the user can refer to the saved data by the lower pipeline to analyze the specific cause of the abnormality when the user gets a notification from the upper pipeline.
The following shows the requirements for constructing this system:
- Process the audit logs, which are added as needed over time, and save the execution results with a delay of about several minutes;
- Keep consistency of the contents when accessing the processing results that are written frequently;
- Table management, such as merging fragmented small files, should be easy.
Streaming processing by Spark
The first requirement for constructing the data pipelines was met by converting data using streaming processing. In this implementation, I used Spark to process streaming data.
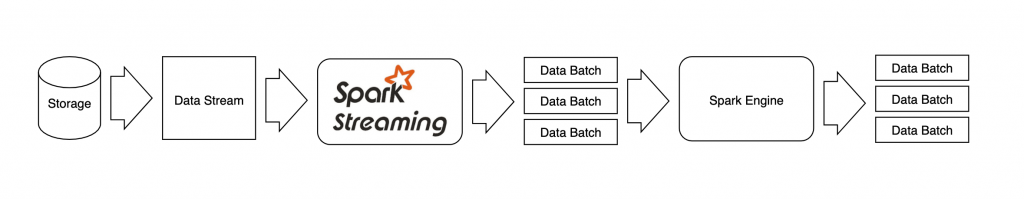
The following figure shows the flow of streaming processing in Spark. In Spark, when a data stream is given, firstly the data is divided into partitions with an appropriate size. The divided data batches are allocated as a task to each node and then each of them is processed in parallel to output the processing result. This processing model (so-called micro-batching) allows us to handle streaming data in a similar way we process batched data.
Spark provides a wide variety of connectors to storage systems, including HDFS and Kafka. HDFS is a data source and destination in the pipelines, and Kafka is a popular distributed messaging middleware. So it is easy to switch to another data source. Moreover, there are also abundant libraries for Spark, such as SQL processing and machine learning, so it has benefits that it can be easily applied to other tasks of the streaming pipelines. Also, it is highly scalable.
Saving in the table with Iceberg format
In the stage following the transformation of data with Spark, the data is saved in the table for analysis. In this implementation, Iceberg was adopted as the format of the data storage table which meets the second and third system requirements. Parquet was used as the data format.
In Iceberg, table updates are managed with snapshots. When a writer adds data to a table, it creates a new snapshot of the table and the data only becomes visible after a successful commit operation. Readers can query point-in-time data referring to a specific snapshot. Thanks to this, Iceberg has atomicity for changes in the table and meets the requirement for consistency.
Iceberg is also useful for reducing the burden of table management. For example, Iceberg provides a built-in utility for performing table compaction. It is particularly useful for stream processing pipelines because it often creates many small files with frequent small write operations and file creations. HDFS NameNode stores every file metadata in memory and can be overwhelmed by a massive amount of metadata if we fail to execute table compaction regularly against the destination table of stream processing.
Iceberg also has ample support for Spark, so it also has the benefit that it is easily incorporated in this streaming processing.
Resource management by Kubernetes
The overall system with Spark mentioned above was deployed on Kubernetes.
The following figure shows the execution flow of the Spark program on Kubernetes. Firstly, the client uses the spark-submit command to submit a program to the master node of Kubernetes, which creates a Spark Driver Pod. After that, the Driver Pod creates as many Spark Executor Pods which executes the actual processing as requested by the client. Then the Executors starts executing allocated tasks in parallel.
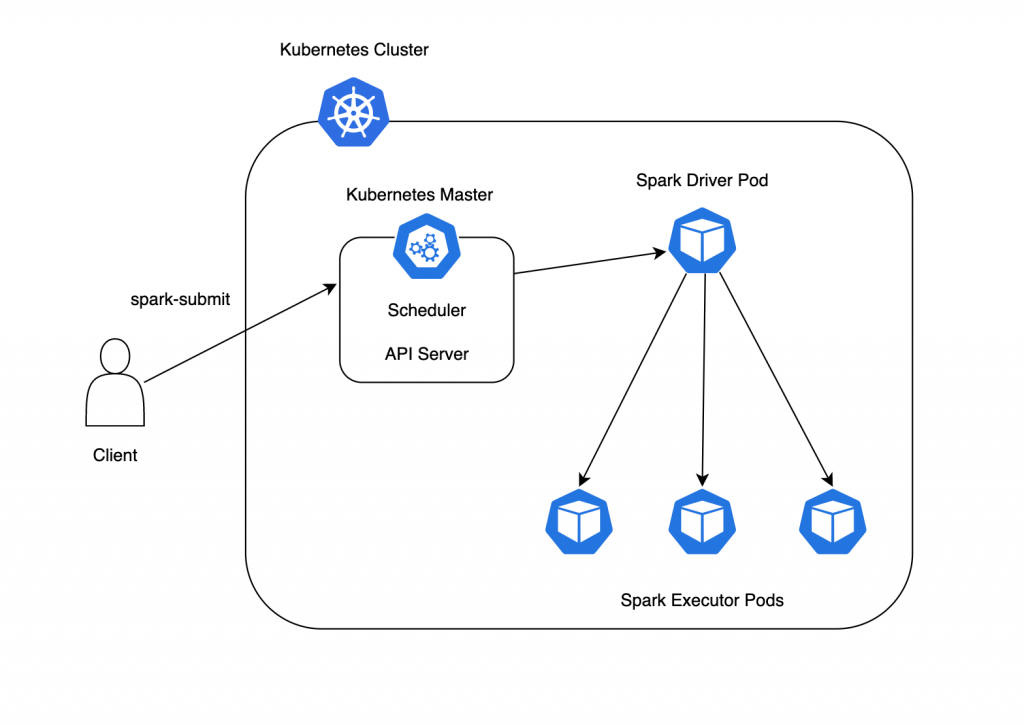
Thanks to Kubernetes, even if the task fails and the Pod is terminated for an unexpected reason, a new Pod will be launched automatically to keep the specified number of Pods, which will keep the system up and running. After spark-submit by the client, Scheduler automatically allocates appropriate computer resources to each Pod, so the resource management is easier. Moreover, applications are packaged as containers, which reduces the cost of managing dependencies among Pods.
In comparison to running Spark on YARN, which is another cluster scheduler, Spark on Kubernetes is beneficial for improving overall resource efficiency when you have general applications and Spark-based batch applications running on a single cluster.
Implementation
The following describes the implementation of each pipeline.
Pipeline for alerting
In the pipeline for alerting, firstly it is inspected whether there is any sign of an abnormality in the information obtained from audit logs. This judgment is based on predefined rules. If any value in data corresponds to the rules, an alert will be generated. For detection of abnormalities, I focused on the following two types of possible abnormalities in clusters:
- Abnormalities in terms of loads associated with a rapid increase in the number of accesses
- Abnormalities in terms of security for unauthorized operations
In the setting of the rules to detect such abnormalities, it was expected that domain knowledge would be used and new rules should be set in the daily operation of the system. Therefore, I wanted flexibility in the rule description method. In this implementation, I enabled to set rules in the SQL query format.
I set the following rules to detect actual abnormalities in terms of loads. When setting these rules, I focused on the operations related to the reading and writing of files executed within a certain period of time, which may increase loads on the machine among operations for clusters.
rule_config = {
    "rule": [
        {
            "alert": "alert1",
            "expr": "cmd = 'create' and count > 100000",
            "message": "alert1 occur",
        },
        {
            "alert": "alert2",
            "expr": "cmd = 'open' and count > 1000000",
            "message": "alert2 occur",
        },
    ]
}
In the pipelines, audit logs are aggregated at certain intervals, and if anything violates specified rules Slack is alerted as shown in the following figure including the details of the violation. The rules of abnormality detection in terms of security are not handled in this implementation but can be set by the same method.
![]()
Pipeline for analyses
In the pipeline for analyses, audit logs given as stream data are converted to the table format of Iceberg and stored in HDFS as with the pipeline of alerting. For the table data, the user can issue the following SQL query via Jupyter Notebook and visualize it into tables, graphs, and so on. The figure shows the data of the range corresponding to the alert mentioned above.
sql_command = "SELECT * FROM hadoop_catalog.db.audit"
spark.sql(sql_command)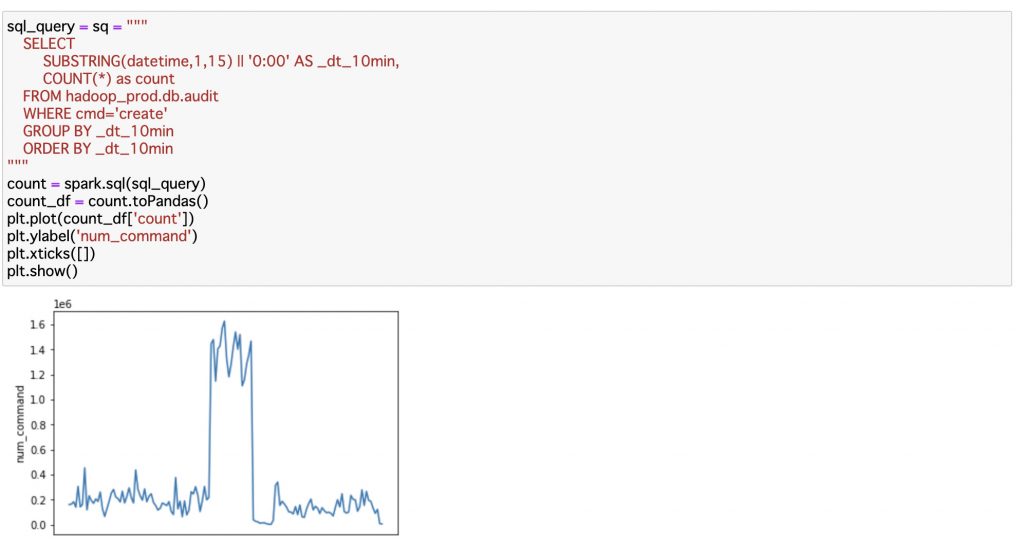
In Iceberg, you can set a commit interval to reflect the contents to be written in the table. In this implementation, the interval is set to one minute, so the delay is about one minute and the data table can be referred to with a lower delay.
The table management such as merging small files is implemented with the following code. In the following example, the file size is about 100MB.
Actions.forTable(table)
             .rewriteDataFiles()
             .targetSizeInBytes(100 * 1024 * 1024) // 100MB
             .execute();
Summary
I created the pipelines to analyze Hadoop audit logs with a short delay of several minutes. This allows us to detect and analyze possible failure points in the early stage. Earlier detection and analysis of failure is important for minimizing the impacts of such failures.
In the future, it may become possible to detect failures earlier by learning patterns of failures using the machine learning framework in Spark. It is also possible to detect unauthorized operations from the history of audit logs and notify the user for security, which I could not implement this time due to the time constraint.
Impression
At first, I was anxious because I had almost no knowledge of the frameworks or other technology handled in this internship. However, I could work on the project without any problem thanks to the support by my mentor such as kindly answering my questions. In addition, my mentor supported me not only in technical aspects but also in many other aspects. I learned many things through discussion, how to determine the direction of work was one such thing I've learned. Moreover, I met many people even in the remote environment through online luncheon parties with team members and other interns. It was the stimulus for me to work in an environment with a totally different scale from the usual environment and these six weeks were really fulfilling. Thank you so much.