
I am a software engineer at LINE and am in charge of developing a monitoring system. I am quite talented at catching cute stuff around me. Thanks to LINE, I was able to attend Elastic{ON} 2017. LINE encourages and supports LINE developers to attend conferences. On this post, I'd like to share my visit to Elastic{ON} 2017 along with some pictures and brief summaries of each session I attended.
Introducing Elastic{ON} 2017
On Site
Elastic{ON} 2017 was held at Pier 48 in San Francisco, U.S.A from March 7th to 9th, 2017. As you can probably tell by the venue name, the conference was held in a warehouse-like building located near the AT&T Park. More than two thousand attendees came from all over the world. The conference was huge.
Elastic Stack products, especially Elasticsearch and Kibana, are widely used at LINE in various ways. I myself am using Elastic Stack in the monitoring system I am in charge of, to save, analyze and visualize events. Our monitoring system had no analyzing feature or visualizing feature until we used Elastic Stack to add these two features. Implementing the new features was simpler than I expected, thanks to Elastic Stack. However, I did encounter some issues while the system was up and running and solving the problems was quite difficult. Now, we are about to upgrade Elastic Stack to version 5.x. I was in a need to learn from other users' experiences and to learn new features and the optimal ways to implement the new features. This is why I attended the conference.
Let me start by showing you some pictures of the conference.
The first thing I did at the conference was getting an attendee card. The conference site was bigger than I expected. The site consisted of session halls, AMA (Ask Me Anything) section, promotional booths, and Elastic booths where I was able to get my hands on the Elastic Stack products.

Elastic made an app just for the conference. With the app, I could check general information of the conference, receive push messages, check session timetables, sign up for sessions, and even check menu. Attendees were able to post and share posts and pictures on the app like we do on LINE's timeline. The app was quite handy during the conference.

Many of my colleagues asked me to get the conference T-shirts for them, but one was only allowed to get one T-shirt (Sorry, my dear colleagues). Once you select an image to be printed on the T-shirt, the Elastic staff printed it for you. One of the staff members saw my attendee card and seeing that I worked for LINE, told me that he uses LINE to communicate with his Japanese friend. "Very good product!" was the compliment I got from him, which made me very proud.

A shuttle bus service was provided between the conference venue and the designated hotel. The conference venue was about 20–30 minutes drive from the hotel. I took benefit of this service to get myself to the conference party, which I will share with you next.

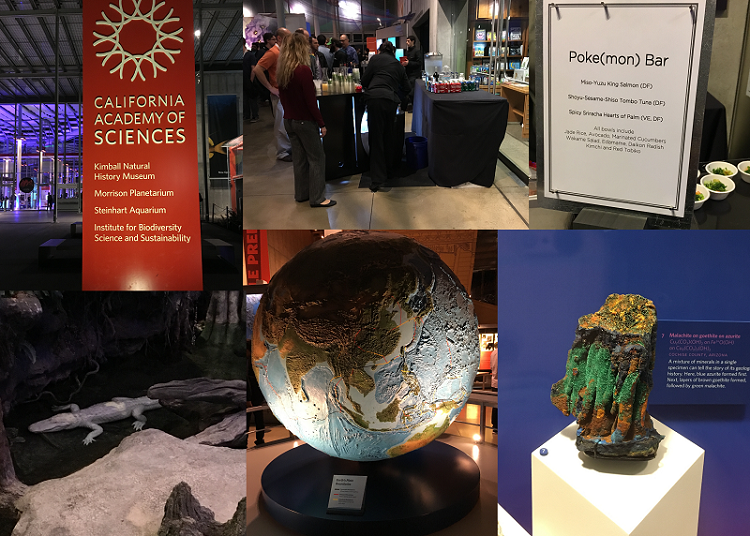
On the evening of the second day of the conference, a party was held at the California Academy of Sciences museum for the conference attendees. Plenty beverages and food had been prepared. The museum had many attractions—a living white crocodile was quite impressive. The aquarium and mineral exhibits made even rather shy attendees to enjoy the party as well.
Although I was satisfied with abundant food and resting places at the conference site, it could have been better in some ways. The session halls had no soundproof walls. Many times I could hardly make out what the speaker was saying due to the sound coming in from outside the hall. The site was a little chilly. Perhaps I could have felt more cold than others because I caught cold right after I arrived at San Francisco. The party was awesome and fantastic, but the long queue for the shuttle bus service to the party venue was very tiresome. Hopefully these disappointments will be resolved next year.
Sessions
Conference sessions covered numerous topics. Let me share the ones I attended.
Right before the opening keynote, a ballerina came up on the stage and started to dance. The screen showed a chart of beats that matched the ballerina's movements. It was as if they were visualizing data as Beats (one of the Elastic Stack products) does. With such magnificent metaphor, Elastic{ON} 2017 began.
Opening Keynote
The opening keynote was given by the founder of Elasticsearch, Shay Banon (currently the CTO of Elastic). He showed numbers and charts to convey that Elastic Stack is being widely used. He then moved on to introducing the new features of Elastic Stack. An impressive point was that at every release of a single Elastic product, Elastic released all other related products too. This enables all the products of one product line conform to have the same version. As an engineer myself, I do frequently release updates, but I find it difficult to update all relevant products at the same time. Their practice—updating all the relevant products at a single product's release—proves that Elastic is doing its best at maintaining its products.
In the second half of the keynote, Banon briefly introduced new features. Each new feature had been allocated a session on its own. I have left links to the sessions at the bottom of session summary for you to have a look at.
I've put myself into Shay Banon's shoes; had I started with a single product and later on end up with a family of related products, and if I were to introduce the ever-advancing products to thousands of people, how proud would I have been? Shay Banon must have been the happiest guy on earth at the opening keynote. At the end of the keynote, Elastic Cause Awards were given out to the organizations recognized for "using Elastic Stack to advance the greater good in the world". How the award honorees used Elastic Stack was introduced in the closing keynote.
What's Evolving in Elasticsearch?
This session was about the changes made in Elasticsearch v5.x and the new features to be added in v6.0. A vast number of changes were introduced in the session as the following:
- Prior to v5.x, multiple REST APIs had to be used to check cluster status in detail when the cluster status was RED. With v5.x, you only have to use a single API,
/_cluster/allocation/explain. - Tribe note is to be deprecated. (Blizzard also covered tribe note in their session, especially about tribe note problems. I have added their session on this post, so check it out.)
- Cross cluster search was an interesting feature because this feature enables searching over multiple clusters in Kibana and other Elastic Stack products.
- Rolling upgrade is supported from v6.0. This means no more downtime for end-users when you upgrade Elasticsearch v5.x to v6.0. This news was such a big and delightful to everyone in the hall, everyone cheered out loud. When upgrading Elasticsearch with a new major version, you had no option but to restart all the clusters, meaning that your service had to be unavailable momentarily. Now with rolling upgrade, you can continue to provide you service as usual while upgrading Elasticsearch.
- Searching is available between 5.x clusters and 6.0 clusters.
As the new versions come without version-sensitive restrictions, Elasticsearch is becoming ever more convenient in terms of operation and facilitation. (With previous versions, we even had to conform our Java client version to that of Elasticsearch.) If you have a genuine interest in Elasticsearch, I strongly encourage you to take a look at this session.
What's Cookin' in Kibana
Kibana's present and future roadmaps were presented. Kibana is a great visualization tool, and I personally consider Kibana as the best product among Elastic Stack products. The session started with introducing new features in v5.0—tag cloud, heat map, search profiler UI—and performance improvement. Let me introduce a few of the Kibana's future roadmap components:
- Log event context: This feature shows what events had been fired right before and right after an error event. This feature will be a tremendous help to error analysis. This feature has been supported in other services such as Loggly, and users have been requesting to have this feature added in Kibana.
- Exporting query data to CSV: Exporting query data into a CSV is a feature which had been long awaited by users (including me) and is soon to be released.
- Time Series Visual Builder: Time Series Visual Builder provides visualization specific to time series data, and can be used to visualized data collected by Metricbeat. I had an impression that Elastic will actively engage in monitoring and time series storage.
There were also talks for Kibana developers. Kibana was originally developed in Angular.js but React will be used for UI from now on. Eventually React will take over Angular.js for Kibana.
What's Brewing in Beats?
We at LINE developed an agent for collecting statistics for the monitoring system. Our agent acts very similar to Metricbeat. I couldn't help but to keep comparing our agent to Metricbeat during the session. The session introduced the following products and features:
- Metricbeat: Topbeat, which only collected system metrics, turned into Metricbeat. Metricbeat supports various modules such as Kafka and Docker.
- Filebeat: Filebeat can be used to easily collect and visualize logs for Apache and nginx.
- Heartbeat: Heartbeat monitors uptime using ping and HTTP requests.
- Self Monitoring: From v6.x, Elastic will add a monitoring feature to monitor Beats itself. Number of metrics sent and CPU usage of Beats are to be monitored. A user friendly interface is to be provided.
Before attending this session, I used to think of Prometheus as one of the hottest among many other open source monitoring systems. From now on, I will have to keep my eyes on Elastic; they earned it.Those of you who are interested in monitoring using Metricbeat, check out this session on monitoring Docker using Metricbeat.
Building a Near Real-Time Pipeline for All Things Blizzard
I am in love with Blizzard games. I had no choice but to attend this session. Blizzard game characters on the presentation slides made the well-made slides even more amusing.
Most companies nowadays probably either collect various data generated from their services into a single platform and analyze the data or at least attempt to make such platform. So was Blizzard. They showed what efforts they made, are making, and will make to build such platform. They shared how they were going to manage schemas for various types of data and their previous attempts to collect as much data as possible. If you are using Kafka with Node.js, I suggest you to try out this high-performance Node.js client for Kafka.
Their story taught me the pros and cons of Elastic Stack and also gave me an opportunity to think through our concerns at LINE on data pipeline.
Correlating Metrics and Logs
Having mainly dealt with metrics and log at LINE, this session was a must-attend for me. The session began by defining metrics and logs and finished by concluding that the two were time series data. The speaker said that metrics and logs should be stored in one storage and displayed on one graph. Interestingly, I have been contemplating myself to have logs and metrics displayed on the same chart for our monitoring system.
This session was more of a promotional session than technical. Unlike most time series databases which support metrics only, Elastic provides enables collecting both metrics and logs, with Metricbeat or Filebeat along with fancy visualization. Elastic made their distinction, being an advanced time series storage, well known through this session.
Machine Learning in the Elastic Stack
Machine learning has been a hot potato lately. In fall last year, Elastic acquired "Prelert", a company specialized in detecting abnormal data. After acquisition, Elastic was quick to add Perlert's expertise on machine learning onto Elastic Stack. A demo introduced how to apply machine learning on Elastic Stack. The first upcoming 'machine learning' feature is highly likely to be related to detecting abnormal data from time series data.
Lately, many of LINE members have requested to have abnormal data detection added on our monitoring system and I happen to handle time series data frequently at work. No wonder my hopes escalated during the session; adding abnormal data detection on our monitoring system might be much easier than I expected, with the help of Elastic's new feature.
For in-depth coverage of applying machine learning on time series data, refer to this session.
Elasticsearch SQL
The point of this session was that Elasticsearch now allows relatively easy SQL for retrieving data. JDBC can also be used to use SQL, which means new Elastic users no longer need to learn Elasticsearch query to use Elastisearch. Those who refused to use Elasticsearch because of having to learn Elasticsearch query will now have to come up with other excuses. I admit, I too had to look up information every time I wanted to create a new Elasticsearch query. Most Elasticsearch users must have wanted to use SQL on Elasticsearch. Now, basic SQL queries and even aggregation queries such as 'GROUP BY' are supported. By the way, we usually think of SQL as "Structured Query Language", but the SQL mentioned in this session stands for "Standard Query Language".
Elastic at Datadog
Datadog is a monitoring service company. (I endear this company because of their logo. Their logo is so adorable.) Since what they do is what I do at LINE, I was fully engaged in this session. Sadly, the session was too short to cover many topics. They basically introduced what 'events' their service offers and how they used Elastic Stack with their service. They migrated from RDBMS to Elastic cluster for event management. I too had a similar experience. The reason for migration was for extendability and performance. They actually experienced performance improvements after migration. At the end of the session, they also explained how they monitor Elasticsearch. For more information, refer to this article introduced in the session.
Closing Keynote
In the closing keynote, the Elastic Cause Awards honorees were invited up on the stage to present their stories. The honorees introduced their projects, how they used Elastic Stack and also pointed out that Elastic is also contributing in real world problems as they do. IST Research shared that their operation environment became smarter by separating master node and data node from one node on Elasticsearch. Cisco had a very similar experience. I had one too. If you are interested in Cisco's story on building a commerce platform using Elastic Stack, listen to their session. The conference ended with a Q&A session with the founding members of Elastic.
There were so many other good sessions I haven't listed on this post. You can enjoy the rest of the session from https://www.elastic.co/elasticon/conf/2017/sf
Epilogue
Elastic{ON} 2017 must have been quite helpful to Elastic Stack users, including both developers and operators. The conference allowed me to learn a lot about new features and learn through the lessons learned by other users. I came across Elasticsearch for the first time in 2011. Back then, Elasticsearch was considered only as an alternative for search engines or for commercial software such as Splunk. I was pleasantly surprised to see Elastic Stack now lined up with so many wonderful products that support all types of environment. Their products even support machine learning as well as monitoring. What Elastic Stack will become is beyond my expectation. However, I believe their achievement would have been impossible without open source contributors.
Elastic Stack has my best wishes. I hope you too could enjoy this awesome conference in a near future.
Thank you.